Crypto Weekly Market Overview: The Countdown to the Fed’s Rate Cut Decision and Strategic Responses
Fear & Greed Index
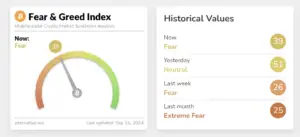
This Tuesday, the sentiment index stands at 39, a 50% increase from last week’s 26. After BTC hovered around 54,000 for a period, it surged to near 60,500 as the weekend approached. The Fear & Greed Index now signals a state of mild fear.
Bullish Factors
Last week, the U.S. Bitcoin Spot ETF saw a net inflow of $400 million, while Grayscale launched the first-ever XRP trust fund in the U.S.
- Outflows from U.S. Ethereum Spot ETFs have slowed.
- The Federal Reserve has released its rate decision and economic outlook summary.
Bearish Factors
- In the daily chart, short-term moving averages are showing a bearish alignment.
This week, it is advisable to focus on
Wednesday, September 19th, 02:00
- U.S. Federal Reserve Interest Rate Decision (Upper Bound) for the period ending September 18th.
Wednesday, September 19th, 02:30
- Federal Reserve Chairman Jerome Powell holds a press conference on monetary policy.
Wednesday, September 19th, 20:30 (UTC+8)
- U.S. Initial Jobless Claims for the week ending September 14th (in tens of thousands).
U.S. stock market trends
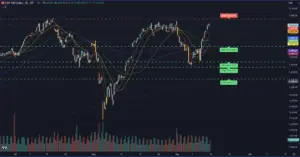
From this 2-hour chart of the S&P 500 index, we can observe that prices are oscillating between key support and resistance levels. The recent upward movement shows that the index is facing resistance around the 5660.52 level, which marks a 0.61% increase from the previous rise.
However, the index appears to be encountering some resistance as it attempts to break through this level. Several critical support levels are highlighted in the chart, located at approximately 5510.34 (-2.06%), 5424.94 (-3.57%), and 5333.69 (-5.2%). These areas could potentially act as support zones should the price decline.
The moving averages reflect mixed momentum signals: while short-term averages remain aligned with the recent upward trend, the overall movement suggests that some volatility may lie ahead.
The Bollinger Bands indicate a clear price fluctuation range, with the current price nearing the upper band, signaling that the market is entering an overbought state and could face pressure for a pullback in the near term. At the same time, the moving averages suggest the continuation of the upward trend, with short-term averages positioned above the long-term ones, indicating that the price still has upward momentum.
Trading volume has fluctuated but remains within a normal range, suggesting that market sentiment has not undergone any drastic shifts. Under the present conditions, a cautious approach is advisable, awaiting more definitive signals, especially given the strength of the current resistance level.
Cryptocurrency Data Analysis
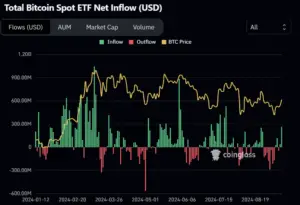
The chart reveals that over the past week, Bitcoin spot ETF fund flows have exhibited noticeable fluctuations. Green bars represent inflows, while red bars signify outflows. In recent days, there has been a significant uptick in inflows, particularly during the last few trading sessions, where net inflows have increased compared to earlier, indicating renewed investor interest in Bitcoin spot ETFs.
At the same time, Bitcoin’s price (yellow line) remains volatile without a clear upward or downward trend. This resurgence in inflows may suggest a shift in investor sentiment toward optimism, potentially driving a short-term rebound in Bitcoin’s price.
Moving forward, it will be crucial to monitor whether this inflow trend persists to confirm a sustained shift in the market.
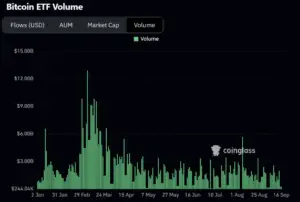
The chart shows that Bitcoin ETF trading volume over the past week (September 9 to September 16) remained relatively stable, with minimal fluctuations. Compared to the peak periods earlier this year, the past week saw no significant surges in trading volume, which generally stayed at lower levels, with some days exhibiting particularly subdued activity.
A closer analysis reveals that during this period, trading volume consistently remained below $3.00 billion, indicating a decline in market interest or activity around Bitcoin ETFs. This could be attributed to a more neutral market sentiment or the overall subdued performance of the broader cryptocurrency market. The contraction in trading volume may also be influenced by macroeconomic factors, regulatory developments, or other external conditions.
Bitcoin Market Analysis
1.Bitcoin daily chart
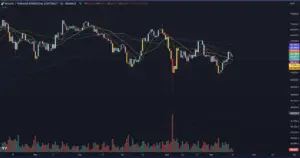
Last week, BTC successfully formed an upward channel on the daily chart, rising to around 60,500. However, without the support of the 21-day and 48-day simple moving averages, this channel lacked sustainability.
We anticipate a downward consolidation this week, making it unwise to chase long positions with large trades. The best strategy would be to short at higher levels. That said, Thursday brings key news, and exercising patience would be the wisest course of action.
Until the 89-day and 144-day simple moving averages converge, no significant trend is likely to form, indicating that this adjustment will require more time.
2.Bitcoin Futures Market Data
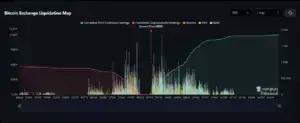
The current market displays a clear divergence in the distribution of short and long leverage liquidations. The green line, representing short liquidations, has been steadily increasing as prices rise, with a notable surge around the $59,300 level, indicating that a substantial number of short positions were liquidated at this key price point, reflecting growing upward pressure in the market.
Meanwhile, the red line, which represents long liquidations, shows a gradual decrease as prices approach this level, suggesting a reduction in long liquidation activity, though some long positions were still forced to close. The $59,000 mark has emerged as a critical price level, where liquidation activity for both long and short positions has intensified.
This volatility near the $59,000 range underscores the need for heightened risk management among market participants and may trigger further price fluctuations and position adjustments.
3.Options Market
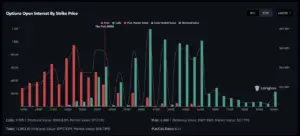
The Bitcoin options open interest chart illustrates the distribution of open positions for call options (green bars) and put options (red bars) across different strike prices. Notably, at the $58,000 strike price, we encounter the “Max Pain” level, indicating that this price point would result in the greatest losses for both buyers and sellers in the options market.
The volume of open call options significantly surpasses that of put options, particularly at the $64,000 and $66,000 strike prices, signaling the market’s expectation of a potential rise in Bitcoin’s price. The data below reveals a total of 9,995.1 call options with a notional value of $590.82M, while put options stand at 6,888.1 with a notional value of $407.03M.
With a Put/Call ratio of 0.41, it is evident that demand for call options far exceeds that for puts, reflecting a sense of optimism among investors regarding Bitcoin’s future price trajectory.
Altcoin Situation
The hottest project of the week is undoubtedly “Fractal.”

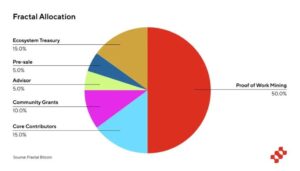
On September 8th, the Bitcoin scaling solution, Fractal Bitcoin, unveiled its tokenomics. 80% of the tokens are allocated to the community, while 20% are reserved for the team and contributors (with a lock-up period). The total supply of tokens is set at 210 million.
Half of the total supply (50%) will be allocated to Proof-of-Work (PoW) mining; 15% will be set aside for the ecosystem treasury; and 10% will be allocated to community grants. The distribution caps for both the ecosystem treasury and community grants are limited to 10% of the total annual allocation over a 10-year period.
An additional 5% will be allocated for the presale, and 15% of the tokens are reserved for core contributors. The vesting schedule for presale and team tokens was clearly defined from the outset, with token unlocks beginning at the end of the 7th month and linearly vesting through the end of the 12th month. Another 5% of tokens are reserved for current and future advisors, with an annual distribution cap of 20%, spanning 5 years.
Following this, on September 9th, Fractal Bitcoin launched its mainnet, offering community incentives and enabling network governance through OP_CAT. The reward distribution for the Bootstrap Plan was completed by September 10th.
However, Fractal has faced significant criticism. The founder of mempool claimed that Fractal Bitcoin copied large portions of Bitcoin Core’s code and plagiarized from Namecoin and Bcash.
He further pointed out that much of the complex terminology in its technical whitepaper is essentially meaningless and criticized the reservation of 50% of the tokens. Whether this critique holds merit is up for debate, and readers are encouraged to investigate further.
Last week, Mysten Labs, the developer behind Sui, opened pre-orders for its handheld gaming console, SuiPlay0x1.
The SuiPlay0x1 natively supports games from the “Sui” ecosystem as well as those from Steam and the Epic Games library, and it runs on Playtron OS, an operating system specifically designed for handheld gaming.
Priced at $599 per unit (excluding shipping and taxes), the device can be purchased using SUI, ETH, or SOL tokens, with an expected delivery date in 2025. The first 1,000 customers to pre-order the SuiPlay0x1 will receive a non-transferable soul-bound NFT, granting them special access, rewards, and benefits.

On the institutional front, Grayscale announced via social media that its Sui Trust (Grayscale Sui Trust) is now open to eligible investors seeking to invest in SUI.
Ecosystem projects are also capitalizing on the momentum! Sui’s liquidity protocol, DeepBook, has released an updated whitepaper, with 10% of its initial airdrop allocated to the community, 28.43% reserved for core contributors and early supporters, and the remaining 61.57% designated for future grants, community programs, and initiatives.
Meanwhile, exchanges are joining the action: Binance has announced the launch of the SUI coin-margined perpetual contract, with up to 20x leverage, scheduled for September 18th at 18:00.


