Crypto Weekly Market Overview: Is the Pullback Beginning or Ending?
Fear & Greed Index
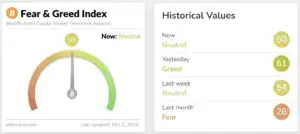
This Tuesday, the sentiment index stands at 50, down 8% from last week’s 54. With BTC having surged near 66,000 and now hovering around 63,500, the Fear & Greed Index remains neutral, reflecting the market’s cautious balance between fear and optimism.
Bullish Factors
- The rate cut policy has injected positive momentum into the market, driving significant surges in both U.S. stocks and gold prices, reflecting a robust market response.
- Continuous inflows into ETFs underscore investor confidence, further solidifying the upward trend in the market.
Bearish Factors
- This Friday marks the expiration of a large number of options, which is expected to trigger notable market volatility and potentially cause short-term disruptions.
- The 63,000 price level is a hotspot for highly leveraged contracts, exerting strong gravitational pull on price movements and likely contributing to heightened market fluctuations.
This week, it is advisable to focus on
Tuesday, October 1st, 22:00
- U.S. September ISM Manufacturing PMI
Wednesday, October 2nd, 20:15
- U.S. September ADP Employment Change (in thousands)
Thursday, October 3rd, 20:30
- U.S. Initial Jobless Claims for the week ending September 28th (in thousands)
Friday, October 4th, 20:30
- U.S. September Unemployment Rate
- U.S. September Nonfarm Payrolls (in thousands)
(All times UTC+8)
U.S. stock market trends
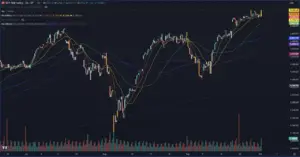
The S&P 500 Index has recently exhibited a clear upward trend, with the index hovering around 5,750 points. Short-term moving averages (such as the 5-day, 10-day, and 20-day moving averages) are positioned above the longer-term averages (such as the 50-day and 89-day moving averages), indicating that the market is currently in an upward channel. While there has been some fluctuation in trading volume, it remains at a generally healthy level.
Bollinger Bands show that the S&P 500 is trading near the upper band, underscoring the strength of the ongoing rally. However, the narrowing of the bands suggests that market volatility may be gradually diminishing, indicating a potential for consolidation or adjustment as the index approaches resistance levels.
In terms of support, key levels are found around 5,660, 5,535, and 5,419 points, corresponding to the Bollinger Bands’ middle line and several critical technical support zones. These levels could provide solid support in the event of a price pullback, especially the middle band around 5,660 points. Should the price break below this level, it could further decline toward the 5,535-point region.
Overall, the current trend leans toward the bullish side, but it is important to monitor the narrowing of the Bollinger Bands and the potential for a pullback as the index approaches its upper limit.
Cryptocurrency Data Analysis
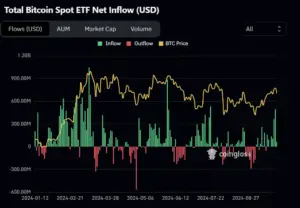
The net inflow data for Bitcoin spot ETFs from September 24 to September 30 reveals a clear upward trend in capital inflows. The green bars highlight significant inflows during this period, with a notable increase in the scale of net inflows, indicating growing investor interest and demand for Bitcoin ETFs.
Additionally, the price of Bitcoin (represented by the yellow line) maintained a relatively steady upward trajectory, supported by the increased inflows, which helped drive the price slightly higher.
This trend reflects a prevailing sense of optimism in the market during this time. The sustained capital inflows likely contributed to the stability and gradual rise in Bitcoin’s price, signaling investors’ confidence in the asset’s future performance.
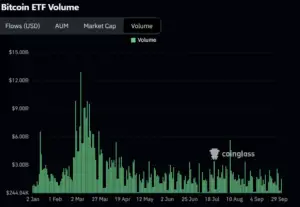
From September 24 to September 30, the trading volume of Bitcoin ETFs remained relatively stable at lower levels, without significant fluctuations or sharp increases. Compared to the peaks earlier in the year, the volume during this period was noticeably lower, indicating a relatively quiet market with subdued trading activity.
Although net inflows increased, the steady volume suggests a more cautious market sentiment, with investors refraining from large-scale buying or selling during this time. This may indicate that the market is in a state of observation, waiting for clearer price signals or external catalysts to drive action.
Bitcoin Market Analysis
1. Bitcoin daily chart
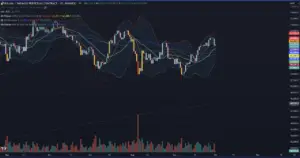
Between September 24 and October 1, Bitcoin’s price movement can be analyzed through three key indicators: Bollinger Bands, trading volume, and moving averages.
Bollinger Bands Analysis
During this period, Bitcoin’s price traded near the upper band, indicating a short-term upward trend. However, as the price approached the upper band, it encountered resistance and began to pull back, suggesting strong selling pressure at higher levels.
The wide gap between the upper and middle bands reflects increased market volatility, but with the bands gradually narrowing, it hints at potential stabilization ahead. If the price continues to retreat, the middle band around $62,538 will serve as a critical short-term support level. Should it break below, the lower band at approximately $57,800 may offer additional support.
Volume Analysis
Throughout late September and early October, trading volume remained relatively stable, without any notable increases. This suggests that while Bitcoin’s price followed an upward trajectory, investor participation was limited, perhaps reflecting a lack of confidence in the current trend. Alternatively, the market could be waiting for clearer external signals to determine future price direction. A surge in volume accompanying price movement would be crucial to confirming the next phase of the market.
Moving Averages Analysis
The moving averages system shows that short-term moving averages (such as the 5-day and 10-day) maintained a bullish alignment from September 24 to October 1, supporting the prior upward trend.
However, with the recent price pullback, the strength of these short-term averages is being tested. If the price fails to hold above the 10-day moving average at $63,723, it could slip towards the longer-term supports, such as the 20-day average at $62,289 or the 50-day average at $60,385. While the overall moving averages remain in a bullish pattern, any significant breach of these key levels could signal a broader market correction.
In summary, Bitcoin demonstrated some upward momentum between September 24 and October 1, but resistance at prior highs triggered a pullback. The market sentiment appears cautious, and Bitcoin may enter a consolidation or corrective phase. There is a need for vigilance regarding the potential downside risks.
2. Bitcoin Futures Market Data
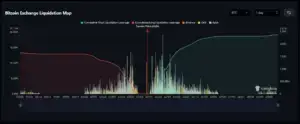
This Bitcoin exchange liquidation map illustrates the leveraged liquidation dynamics at the current price of approximately $63,684. At this level, short position liquidation pressure is concentrated below $64,400, indicating that if the price continues to rise, a significant number of shorts will face liquidation, potentially driving the price higher.
Conversely, long position liquidation pressure becomes more pronounced below $62,800, meaning that if the price falls to this level, longs will face liquidation risk, potentially triggering sell-offs and leading to a price correction.
Thus, the market is currently in a critical range, where price movements could significantly impact both long and short liquidations, intensifying market volatility.
3. Options Market
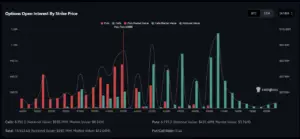
The Bitcoin options open interest distribution depicted in the chart reveals that the max pain point is situated at $63,000. The red bars represent put options, while the green bars signify call options. A significant increase in open interest is observed around the $63,000 mark, with puts notably outnumbering calls, indicating substantial pressure in this price range.
Furthermore, as the price moves higher, there is considerable open interest in call options between $64,000 and $71,000, suggesting that investors broadly anticipate a price rise within these levels. However, below $63,000, put options are more concentrated, implying that if the price drops below this threshold, more market participants could find themselves in profitable positions, potentially intensifying selling pressure.
Overall, $63,000 stands as a pivotal price level where the options market’s tug-of-war between bulls and bears is focused, and any price movement around this point is likely to provoke a significant market response.
Altcoin Situation
1. Abstract
Bitcoin has surged past the 65,000 mark, driving a broad rally in altcoins, with some tokens experiencing gains of over 40%. Market sentiment is steadily recovering, though various indicators suggest that the true “altcoin season” is still some distance away.
At the same time, a wave of MEME frenzy is sweeping across major blockchains, with the “zoo” market phenomenon reappearing after a three-year hiatus.
From the perspective of BTC’s market dominance, it remains within a high-range zone.
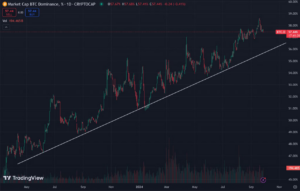
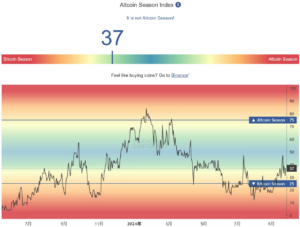
The altcoin season has yet to begin. This Friday, the Altcoin Index stands at 37, indicating the early stages of decoupling from Bitcoin’s dominance. Compared to the overall market performance this year, this is one of the higher levels since Bitcoin peaked in the first quarter, and this upward trend continues to gain momentum.
2 .Popular Projects
MOO Deng (Animal-themed MEME)
Reasons for Popularity
- Widespread discussion across social media platforms
- Token prices soaring steadily
- Heightened community enthusiasm
Recommendations
- Keep an eye on well-known animals from the Web2 world
- Monitor the ongoing development of animal-themed MEMEs

The viral hippopotamus, Moo Deng, also known as the “Bouncing Pig,” is a pygmy hippo born at Khao Kheow Open Zoo in Chonburi Province, Thailand. Its charming and amusing behaviors—such as waddling walks, rolling on the floor, and opening its mouth wide in a seemingly playful attempt to bite—have captured the hearts of online audiences.
Videos of Moo Deng have spread widely across the internet, quickly making it a sensation on social media in Thailand, Japan, Korea, and China. On platforms like Xiaohongshu, the hashtag “Bouncing Pig” has garnered nearly 900,000 views.
The Hottest Project on Pump.fun
The viral popularity of Moo Deng has given rise to a related MEME token on Pump.fun, which saw an astonishing 100x surge within just two weeks. Moo Deng’s market cap is now approaching the $200 million mark, making it the top-ranked project by market cap on Pump.fun. In comparison, the second and third-ranked projects, “Mother” and “Michi,” both have market caps of around $130 million.
Remarkably, Michi was launched six months ago, highlighting the incredible rise of Moo Deng, driven by intense community enthusiasm and market speculation.

With Binance’s listing of Neiro reigniting the Ethereum MEME craze, the viral spread of Moo Deng continues, with several similarly named MEMEs emerging on Ethereum. The competition between Solana and Ethereum has grown increasingly intense. However, compared to Ethereum, Solana has outperformed in both trading volume and liquidity.
Still, Ethereum enjoys a notable advantage, with PePe developers openly backing projects, followed by funds sent to Vitalik Buterin, signaling potential future celebrity endorsements.
Previously, the Neiro MEME project on Ethereum sent 17.1 billion Neiro tokens (4% of the total supply) to Vitalik Buterin’s wallet after its creation, leveraging this move to claim that Buterin was the largest holder of the project.
This marketing strategy proved effective. On August 5th, when Vitalik sold off animal tokens in his wallet and donated the proceeds to charity, it was in response to an official $Neiro tweet. This caused the MEME token to surge back to life, with a 4x increase in just 24 hours.

OKX has tweeted or hinted at the potential listing of Moo Deng. Fueled by its immense popularity, Moo Deng’s mother, Jona, has also seen a significant rise, with a staggering 3008% increase in the last 24 hours. As the entire family ecosystem gains traction, there may still be opportunities to explore from various angles.


