
Crypto Weekly Market Overview: The Theme of the Week is Patience — Wait for the Pullback to Go Long
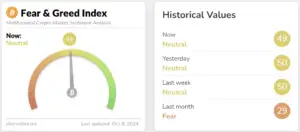
Fear & Greed Index
As of this Tuesday, the sentiment index stands at 49, down slightly from last week’s 50, marking a 2% decrease. After BTC dipped below 60,000, it quickly rebounded to around 64,000 and is currently hovering near 62,300.
The Fear & Greed Index remains neutral, reflecting the balanced sentiment in the market.
Bullish Factors
- Bitcoin’s Resilience: October has traditionally been a strong month for Bitcoin, and this year is no exception. Bitcoin continues to show a positive trend, with analysts predicting upward potential throughout the month.
The launch of Bitcoin spot ETFs has further boosted market optimism. Consistent inflows into ETFs reflect growing investor confidence, further solidifying the market’s upward trajectory.
- Positive Market Sentiment: Overall, market sentiment remains upbeat. Macroeconomic developments, such as the release of U.S. employment data, have indirectly influenced activity in the cryptocurrency market. Investors remain optimistic about the latter half of October, especially with key events such as the ongoing XRP vs.
SEC legal developments and the FTX hearings, which could further stimulate market dynamics.
Bearish Factors
- Options Expiration: This Friday will see a large expiration of BTC options, with the max pain point at $62,000. This event could cause short-term volatility and potential market disruption.
- Potential Market Pullback: Technical analysis of both U.S. equities and cryptocurrencies suggests a potential market correction or pullback, which could negatively impact prices in the near term.
This week, it is advisable to focus on
Thursday, October 10th, 20:30 (UTC+8)
- U.S. September Year-on-Year CPI (not seasonally adjusted)
- U.S. September Month-on-Month CPI (seasonally adjusted)
- U.S. Initial Jobless Claims for the week ending October 5th (in thousands)
Friday, October 11th, 22:00 (UTC+8)
- U.S. October 1-Year Inflation Expectations (Preliminary)
- U.S. October University of Michigan Consumer Sentiment Index (Preliminary)
(All times UTC+8)
U.S. stock market trends
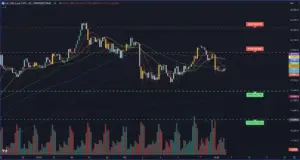
From the chart analysis, the current price is situated near the middle band of the Bollinger Bands, indicating that the market is in a relatively balanced state. However, the wide distance between the upper and lower bands suggests that volatility has increased recently. In the short term, the middle band (19,812 points) serves as an important support level.
The Simple Moving Averages (SMA) show that the short-term averages (such as the 5-day and 10-day SMAs) have started to flatten or slightly tilt downward, signaling a potential weakening of upward momentum. This indicates that the market might be entering a consolidation or downtrend phase. If the price continues to decline, the next significant support level would be around 19,592 points, near the lower Bollinger Band.
In terms of resistance, the previous highs of 19,978 and 20,222 points stand as notable resistance levels, which have repeatedly hindered upward movement.
Overall Analysis
- Support Levels: 19,812 points (middle Bollinger Band), 19,592 points (lower band), and 19,308 points (lower support).
- Resistance Levels: 19,978 points and 20,222 points.
The market may be facing a short-term pullback, and it is important to watch how the support levels hold up. If the price breaks below the middle band and short-term SMA support, it could further decline toward the lower Bollinger Band support.
Cryptocurrency Data Analysis
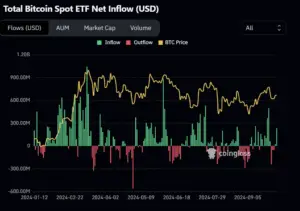
Data from October 1 to October 8, 2024, on Bitcoin spot ETF net inflows demonstrates robust capital movement in the market. The green bars show a marked increase in net inflows during this period, particularly in early October, signaling a sustained interest in Bitcoin spot ETFs. At the same time, Bitcoin’s price followed a steady upward trend (represented by the yellow line), supported by the continuous inflow of funds.
This trend reflects a generally optimistic market sentiment, with inflows bolstering Bitcoin’s price rise. Although there were occasional red bars indicating outflows, the overall increase in net inflows suggests strong investor confidence, with a positive outlook for future price movements. This pattern of capital flow is likely to drive further upward momentum for Bitcoin and sends a positive signal for the broader cryptocurrency market.
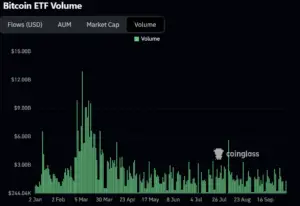
From the Bitcoin ETF trading volume data between October 1 and October 8, 2024, it is clear that volume remained at relatively low levels, without any notable spikes or significant increases.
Compared to the peak trading volumes seen between January and March, the current trading activity appears subdued, reflecting a more cautious market atmosphere.
Despite an uptick in market sentiment and increasing net inflows during this period, the steady volume suggests that investors remain in a wait-and-see mode, refraining from large-scale buying or selling. This could indicate that while market optimism has begun to return, investors are still holding off, awaiting clearer market signals or external catalysts before making decisive moves.
This calm in trading volume, despite positive market sentiment, suggests that while the overall mood is improving, investors are waiting for stronger confirmation before acting more aggressively.
Bitcoin Market Analysis
1. Bitcoin daily chart
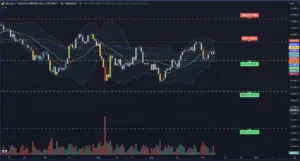
Between October 1 and October 9, 2024, Bitcoin’s price movement can be analyzed through Bollinger Bands, trading volume, and moving averages.
Bollinger Bands Analysis
For much of this period, Bitcoin’s price fluctuated between the middle and upper bands, indicating strong upward momentum. However, as it approached the upper band, resistance kicked in, pushing the price back toward the middle band.
The gradual widening of the upper and lower bands suggests that market volatility has increased. The upper band around $65,812 represents short-term resistance.
Volume Analysis
Trading volume during this period remained relatively stable, without significant spikes. Despite the price rising, the lack of a substantial increase in volume suggests limited interest from traders within this price range.
This stable volume reflects a cautious market sentiment, with no large-scale buying or selling taking place, which could suggest investors are waiting for stronger signals.
Moving Averages (MA) Analysis
The short-term moving averages (such as the 5-day and 10-day MAs) remained in a bullish formation, supporting the previous upward trend. However, there is a slight tendency for these short-term averages to shift toward a bearish crossover as the price has recently pulled back.
If Bitcoin’s price continues to decline, it may test the 50-day MA at $60,719 and the 200-day MA at $59,773, which are critical levels of support to monitor. A break below these levels could signal a more significant correction.
Overall Conclusion
Currently, Bitcoin hovers near the middle band of the Bollinger Bands, facing resistance from the upper band. If it fails to break through this resistance and volume remains low, the market may continue to consolidate or pull back. Support lies between $60,000 and $59,000.
Traders may find it prudent to wait for a pullback to go long, while those seeking short-term profits might consider shorting with appropriate stop-loss measures in place.
2. Bitcoin Futures Market Data
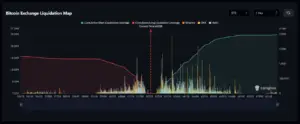
From this Bitcoin liquidation map, we can see that the current price is approximately $62,338. The chart illustrates the liquidation pressure on both long and short leveraged positions:
- The red zone on the left represents the cumulative liquidation pressure on long positions, especially around the $61,640 level. At this point, long traders are at significant risk of being liquidated if the price continues to decline, which could trigger further downward pressure on the market.
- The green zone on the right shows the cumulative short liquidation leverage. Specifically, near the $62,943 level, short positions are facing potential liquidation. If the price rises beyond this point, it may cause a wave of short liquidations, sparking a market rebound and driving the price higher.
Overall, the market is in a crucial price range, and the direction of future price movements will determine whether long or short positions will face more liquidation pressure.
3. Options Market
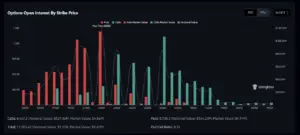
Based on the detailed data from this Bitcoin options open interest distribution chart, the max pain point is located at $62,000, meaning this price level is where both long and short options positions are most concentrated. Here’s a breakdown of the key data
- Comparison between Call Options and Put Options:
- Call options: A total of 8,467.2 contracts with a notional value of $527 million and a market value of approximately $4.56 million.
- Put options: A total of 8,738.2 contracts with a notional value of $544 million and a market value of about $4.91 million.
- Put/Call ratio stands at 0.51, indicating a slightly bullish sentiment. The market value and the number of call and put options are relatively close, with puts slightly outnumbering calls but not dominating the market.
- Key Price Ranges
- $50,000 to $62,000: Put options are highly concentrated within this range, particularly around $62,000, showing strong selling pressure at this level.
- $64,000 to $66,000: Open interest in call options rises significantly, especially near $66,000, suggesting that if Bitcoin’s price rises to this level, the market could see a strong bullish push.
- Market Sentiment and Potential Volatility:
- The $62,000 level is crucial, as the max pain concentration suggests significant price volatility around this point.
- If the price moves upward, $66,000 becomes a key resistance level, where accumulated call options could drive the price higher.
- Conversely, if the price falls, the $50,000 level represents a strong put option concentration, signaling bearish sentiment in this range.
Summary: The options market battle between bulls and bears is focused around $62,000 and $66,000, making these the key price zones to watch. While the sentiment leans slightly bullish, the selling pressure near $62,000 remains substantial. A break above $66,000 could trigger a stronger upward trend.
Altcoin Situation
- Sui

Interest in “Sui” continues to surge, with the project rising to the top of the trending list this week—largely driven by its price movement, which defied the market and reached a new high. Mysten Labs seems to have realized that “when the technology is good enough, ‘number goes up’ is the best marketing strategy.”
- EIGEN

EigenLayer’s Total Value Locked (TVL) surpassed $12 billion last week, marking a significant milestone. The Eigen Foundation also announced that the “EIGEN” token became transferable on October 1st at 12:00 PM Beijing time, effectively making it tradable on exchanges.
EIGEN was listed on nearly all major exchanges, and with an initial listing price of 4.08 USDT, its Fully Diluted Valuation (FDV) was approximately $6.8 billion. This valuation is even lower than the FDV of ether.fi’s ETHFI token at its peak, highlighting the importance of launching tokens at the right market timing.
Notably, Justin Sun sold his entire airdrop of 5.374 million EIGEN tokens at an average price of $4.03, netting a total of 21.66 million USDT. How did your airdrop gains compare?
EIGEN Ecosystem Trending Topics
- Puffer’s Airdrop Compensation: Puffer announced that it will fully compensate for the diluted EIGEN airdrop due to an error in third-party data from zkLink Nova.
The platform proactively repurchased EIGEN tokens from the market to ensure all Puffer users received their rightful airdrops. Additionally, Puffer will distribute extra PUFFER tokens to all users as compensation.


2 replies on “Cryptocurrency Weekly Market Overview(01 October – 07 October)”
Ok
از تیم بیت یونیکس واقعا چنین قدرتمند و با مهارت هستید متشکرم