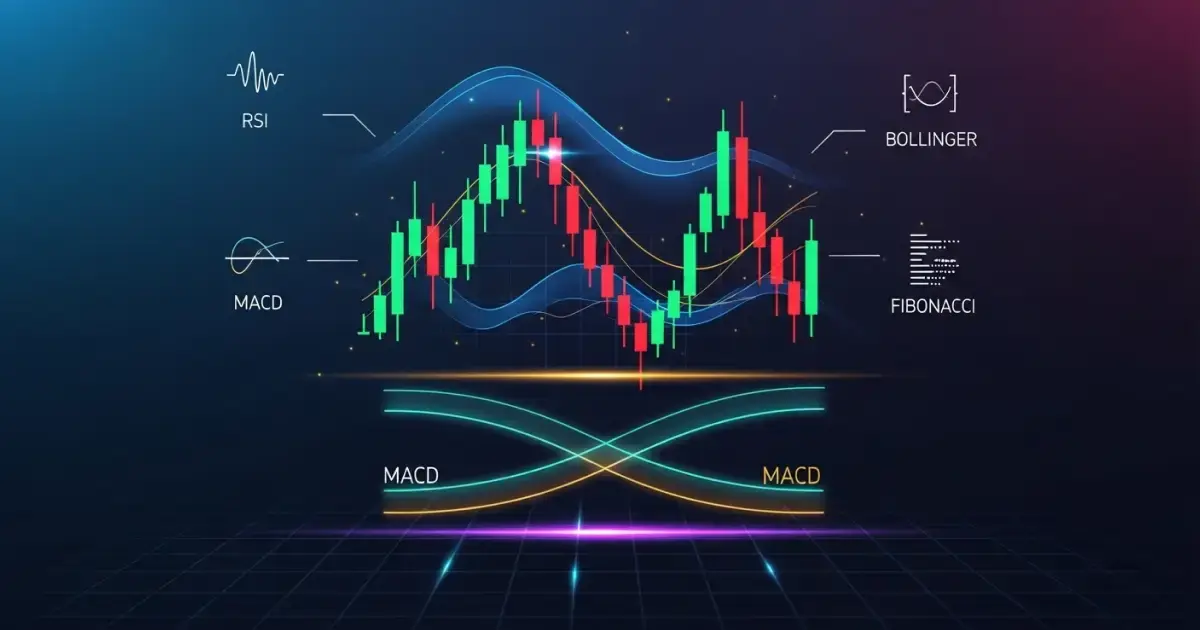
In 2025, the crypto market is faster, more competitive, and full of opportunities. Have you ever wondered why some traders seem to predict crypto price movements with mysterious accuracy? The secret isn’t magic – it’s crypto technical indicators. Using the right combination of indicators, from RSI to Fibonacci retracement, can help you spot trends early, time your trades better, and reduce risk, all without guessing.
So, how do you use crypto technical indicators effectively without drowning in false signals? In this guide, you’ll discover:
- The best crypto trading indicators and why they work
- How to combine indicators for stronger signals
- Common pitfalls traders face and how to avoid them
- Real-world trading strategies used by experts
Ready to turn charts into profits? Let’s break down the most effective indicators, explain how they work, and show you how to combine them for maximum results.
What Are Crypto Technical Indicators?
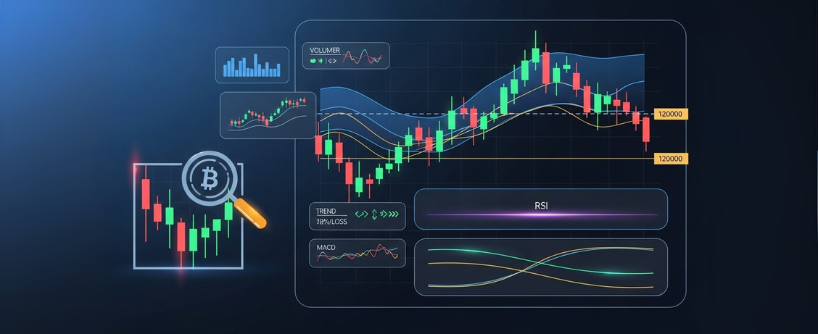
Before diving into specific indicators, it’s important to clarify what they are. In cryptocurrency trading, technical indicators are analytical tools that examine price movements, trends, and market patterns. They apply mathematical calculations to data such as price, trading volume, or open interest, enabling traders to forecast potential market behavior and determine optimal entry or exit points.
Think of technical indicators as your trading GPS system. Just as you wouldn’t drive through an unfamiliar city without navigation, you shouldn’t touch the crypto markets without these analytical tools. With the help of indicators, traders can:
- Identify potential entry and exit points
- Track price movements
- Create custom alerts to act fast
The beauty of crypto technical indicators lies in their objectivity. While emotions can cloud judgment and lead to impulsive decisions, indicators provide mathematical calculations that help remove the guesswork from your trading strategy.
Why Technical Indicators Matter in Crypto Trading
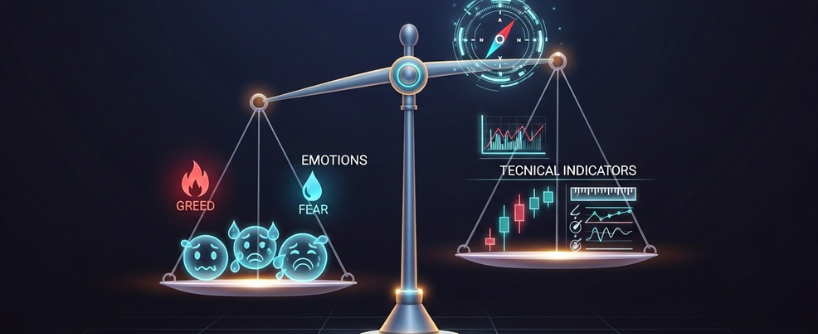
Technical indicators are more than lines and numbers on a chart; they are the signals that help traders understand market behavior.
- Trend Detection: Indicators like moving averages show whether a coin is trending up, down, or sideways.
- Momentum Analysis: Tools like RSI and MACD help identify the strength behind price movements.
- Entry and Exit Points: Fibonacci retracement levels and Bollinger Bands highlight potential buy and sell zones.
- Risk Management: By confirming trends and spotting reversals early, indicators help protect your capital.
Without these tools, trading becomes disorganized and inefficient, reducing the likelihood of making consistent, well-informed decisions.
The Four Categories of Trading Indicators
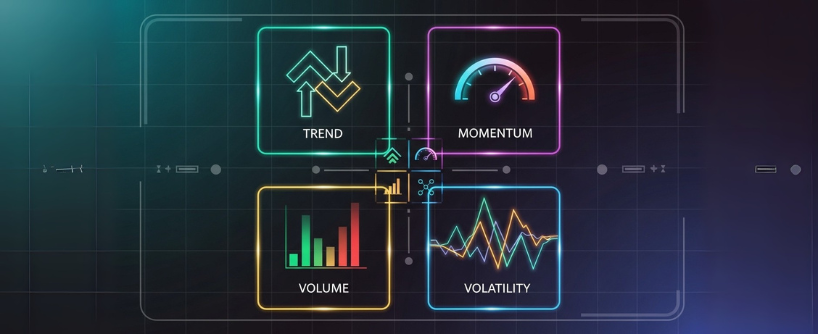
Understanding the different types of indicators is crucial for building effective trading strategies. In technical analysis, technical indicators can be grouped into four main categories:
Trend Following Indicators: help you identify the overall direction of the market. These include moving averages and trend lines that show whether an asset is in an uptrend, downtrend, or sideways movement.
Momentum Indicators: measure the speed and strength of price movements. They help determine whether an asset is overbought or oversold, potentially signaling reversal points.
Volume Indicators: analyze trading activity alongside price movements, providing insights into the strength behind price changes.
Volatility Indicators: measure price fluctuations and help traders understand market uncertainty and potential breakouts.
The key to successful trading lies in combining indicators from different categories. A good practice is to combine only those technical indicators that offer distinct types of signals about market conditions.
Top Crypto Indicators You Must Know in 2025
Let’s explore the best indicators for crypto trading signals, why they matter, and how to interpret them.
Moving Averages (MA)
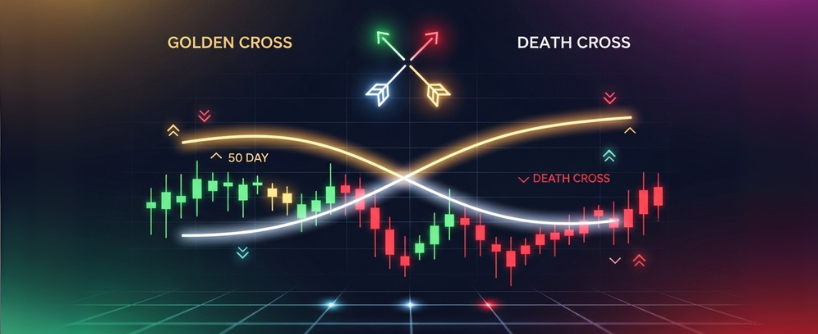
A moving average (MA) is simply the average price of an asset over a set period. It smooths out noise, helping you see the trend direction. There are two main types:
- Simple Moving Average (SMA): The SMA treats all data points equally, summing up closing prices and dividing by the number of periods. For instance, a 50-day SMA adds the last 50 closing prices and divides by 50, perfect for long-term trends.
- Exponential Moving Average (EMA): Gives more weight to recent prices, making it more responsive. They’re calculated using a multiplier that emphasizes the latest data, ideal for short-term trading in fast-moving crypto markets.
How do you use them? In crypto trading, moving averages help identify trends and generate buy or sell signals through crossovers. A “Golden Cross” occurs when a shorter-term moving average line (like a 50-day EMA) crosses above a longer-term one (e.g., 200-day EMA), signaling upward momentum and a potential buy. Conversely, a “Death Cross” happens when the short-term line dips below the long-term, indicating bearish momentum and a sell signal. These crossovers are gold for spotting trend reversals.
Pros? They’re easy to understand and versatile for any timeframe.
Cons? They lag behind real-time price action, so they’re best paired with other technical indicators to confirm future price movements.
If you’re just starting, experiment with a 50-day and 200-day EMA on your favorite crypto, you’ll be amazed at how they clarify the chaos.
Relative Strength Index (RSI)
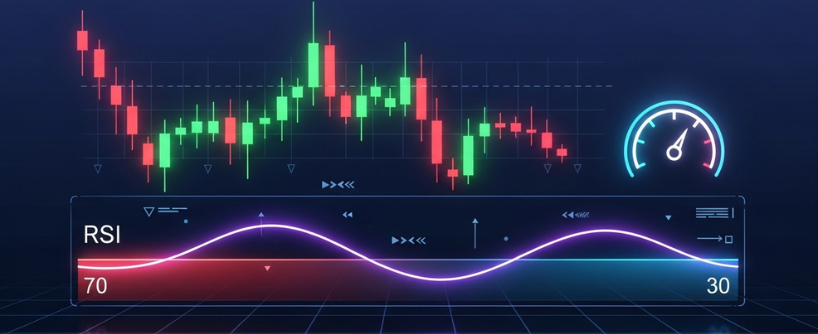
RSI is a momentum oscillator that measures the speed and change of price movements on a scale of 0 to 100. Developed for stocks but perfectly suited for crypto, RSI helps identify overbought conditions (above 70) where prices might be due for a pullback, and oversold conditions (below 30) signaling potential rebounds.
How does it work? RSI compares recent gains to losses over a typical 14-period window, highlighting when an asset is gaining or losing momentum. In crypto, where pumps and dumps are common, an RSI value above 70 suggests bearish momentum could kick in, prompting sell signals. Below 30? It might indicate upward momentum building for a buy.
Divergences are RSI’s secret weapon. If prices hit new highs but RSI doesn’t, it signals weakening momentum and potential reversals. Combine RSI with trend lines or candlestick patterns for better accuracy; it’s not foolproof alone, as crypto’s volatility can produce false signals. Many traders tweak the thresholds (e.g., 80/20 for stronger trends) to suit the market’s wild swings.
If you’re trading altcoins, RSI crypto analysis can be a game-changer for timing entries and exits.
Warning: RSI works best in ranging markets. In strong trends, it can give false signals.
MACD (Moving Average Convergence Divergence)
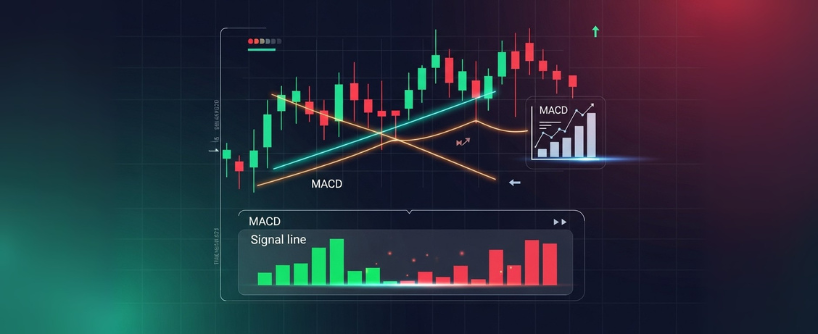
MACD shows the relationship between two exponential moving averages (typically 12-period and 26-period EMAs). The MACD line is their difference, plotted against a signal line (9-period EMA of the MACD) and a histogram visualizing the gap.
In MACD trading, crossovers are key: When the MACD line crosses above the signal line, it’s a bullish buy signal indicating gaining momentum. A cross below signals bearish momentum and potential sells. The histogram amplifies this – widening bars show strengthening trends, shrinking ones suggest losing momentum.
Watch for zero-line crossovers – the MACD crossing above zero confirms upward trends. But beware false signals in ranging markets; pair it with volume indicators for validation. MACD’s versatility makes it one of the best indicators for crypto trading signals, especially for day traders chasing quick moves.
Pro Tip: Use MACD in combination with RSI. While MACD confirms trend changes, RSI helps you judge whether the move is overextended or sustainable.
Bollinger Bands

Bollinger Bands consist of a middle simple moving average (usually 20-period) and two standard deviation bands above and below it. The bands expand during high volatility and contract (squeeze) in calm periods, signaling impending breakouts.
In Bollinger Bands crypto strategies:
- Bands squeezing together indicate low volatility and a potential breakout.
- Price touching the upper band suggests overbought conditions; the lower band indicates oversold conditions.
Advanced Tip: Combine Bollinger Bands with RSI or MACD. A squeeze followed by RSI confirmation can be a powerful trade signal. And keep in mind, in strong trends, prices can ride the bands; don’t assume reversals too soon.
Fibonacci Retracement and Extension
Fibonacci retracements, based on the Fibonacci sequence (where each number is the sum of the two preceding ones), plot horizontal lines at key ratios like 23.6%, 38.2%, 50%, 61.8%, and 78.6% to identify potential support and resistance levels during pullbacks.
To use them, draw from a swing low to high in an uptrend (or vice versa). These retracement levels act as zones where prices might find support or resistance. In crypto, they’re rooted in market psychology – traders expect reversals at these “golden” ratios.
For example, after a Bitcoin rally, prices retraced to the 61.8% level and bounced, offering an entry. Shallow retracements (38.2%) signal strong market trends; deeper ones (78.6%) warn of weakness. Set stops beyond the next level and targets at extensions (161.8%) for profits.
Limitations? Subjective swing points can vary, and they’re less effective in sideways markets.
Pro Tip: Fibonacci extensions (e.g., 123.6%, 161.8%) help set profit targets once a trend resumes. For extra accuracy, combine Fibonacci levels with trend indicators like EMAs or momentum indicators like MACD.
The Smart Way to Combine Indicators for Crypto Trading Success
Combining indicators wisely is the key to advanced crypto trading. The goal is to mix indicators from different categories, so you get distinct, complementary signals.
Indicator Categories:
- Trend: Moving averages, Parabolic SAR
- Momentum: RSI, MACD, Stochastic Oscillator
- Volume: OBV, Money Flow Index
- Volatility: Bollinger Bands, ATR
Beginner-Friendly Example:
- Step 1: Check trend direction with a 50 EMA vs 200 EMA.
- Step 2: Confirm momentum with RSI (>50 for bullish, <50 for bearish).
- Step 3: Identify potential entry points with Fibonacci retracement.
- Step 4: Monitor volatility with Bollinger Bands for breakout timing.
This approach reduces false signals and ensures that your trades are high-probability setups, not guesses.
The Triple Confirmation Method
Here’s a powerful combination strategy that many successful traders use:
- Trend Identification with Moving Averages
Use the 50-day and 200-day EMAs to determine the overall trend direction. Trade only in the direction of the primary trend for higher probability setups.
- Momentum Confirmation with RSI
Traders often look for a scenario where the RSI signals an oversold condition (below 30). This suggests the coin may rise soon.
- Entry Timing with MACD
At the same time, they will observe whether the MACD lines are crossing upward, confirming that market momentum is shifting in a bullish direction.
This triple confirmation approach significantly reduces false signals and improves trade accuracy.
Volume Confirmation: The Missing Piece
Don’t overlook volume indicators like On-Balance Volume (OBV). OBV is a cumulative total of trading volume, which means it adds up all the trading activity over time.
If the OBV increases while the price stays steady or experiences a slight decline, it could indicate that large buyers are accumulating positions, potentially leading to a price increase in the near future. This can provide early warning signals for significant price movements.
Common Mistakes to Avoid in Crypto Technical Analysis
Here are well-known mistakes that kill trading profits:
Mistake #1: Using Redundant Indicators
For example, the RSI and stochastic indicators are both momentum indicators that provide the same type of information about the market. Using both creates a false sense of confirmation when you’re actually seeing the same signal twice.
Mistake #2: Ignoring Market Context
Technical indicators work best when combined with understanding market context. Support and resistance levels, trend lines, and candlestick patterns provide the framework within which indicators should be interpreted.
Mistake #3: Over-relying on Single Indicators
No single indicator is foolproof. There are many indicators to help you make more money when trading cryptocurrencies. But to be certain of the price movement of an asset, it is advised to use multiple indicators to find if they’re all hinting at the same outcome.
Pro tips: Backtest strategies, use multiple timeframes, and incorporate price action like candlestick patterns. Stay disciplined; indicators guide, not dictate.
Risk Management: Your Trading Safety Net
Even the best indicators can produce false signals. Successful traders always incorporate risk management:
Position Sizing: Never risk more than 1-2% of your total portfolio on a single trade, regardless of how confident your indicators make you feel.
Stop Losses: Set stop losses based on technical levels, not arbitrary percentages. Support and resistance levels often make excellent stop loss placement points.
Take Profits: Use Fibonacci extension levels to identify potential profit-taking zones. Fibonacci Extension is applied to estimate possible price targets beyond the original move, following the completion of a retracement.
Practical Trading Strategy Example
Imagine Bitcoin is trending upward.
- The 50 EMA is above the 200 EMA → confirms bullish trend.
- RSI sits at 55 → momentum is healthy but not overbought.
- Price pulls back to the 61.8% Fibonacci retracement → potential entry point.
- Bollinger Bands are slightly tight → volatility might increase soon.
- MACD confirms upward momentum → trade executed.
Stop-loss is just below the next Fibonacci level, and profit target aligns with the previous high or Fibonacci extension.
This systematic approach removes emotion and provides clear, objective trading decisions.
Building Your Personal Trading System
Creating a systematic approach to using technical indicators involves several key steps:
Step 1: Select 3-4 indicators from different categories that align with your trading style and timeframe.
Step 2: Create specific entry and exit criteria. For example: “Enter long when price is above 200 EMA, RSI crosses above 30, and MACD shows bullish crossover.”
Step 3: Test your indicator combinations on historical data to understand their effectiveness and limitations.
Step 4: Practice your system with virtual money before risking real capital.
Conclusion: Your Path to Trading Success
Mastering crypto technical indicators isn’t about memorizing every indicator or finding the “holy grail” combination. It’s about understanding how different indicators complement each other and building a systematic approach that suits your trading style and risk tolerance.
The key takeaways for your trading journey:
- Combine indicators from different categories to avoid redundancy and gain comprehensive market insight
- Practice patience and wait for multiple confirmations before entering trades
- Always incorporate risk management, regardless of how confident your indicators make you feel
- Continuously educate yourself as markets evolve and new patterns emerge
Technical indicators are powerful tools, but they’re not magic. They require practice, patience, and continuous learning. Start with the basics – moving averages, RSI, and MACD, then gradually incorporate more advanced techniques as your experience grows.
The crypto market will continue to evolve, but the fundamental principles of technical analysis remain constant. By mastering these indicators and applying them systematically, you’re not just learning to trade; you’re developing a skill that will serve you throughout your entire investment experience.
FAQs
What are the best indicators for cryptocurrency trading?
The best indicators depend on your strategy, but many traders rely on exponential moving averages, Fibonacci retracement levels, and on-balance volume as core analysis tools.
How do crypto trading indicators improve decision-making?
Crypto trading indicators help interpret price charts, identify trends, and confirm entry or exit points when combined with other indicators.
Why use exponential moving averages in crypto trading?
Exponential moving averages react faster to recent price changes, making them useful for spotting short-term momentum shifts in cryptocurrency trading.
How can Fibonacci retracement levels be applied in trading?
Fibonacci retracement levels highlight potential support and resistance zones, helping traders anticipate price reversals or continuation patterns.
Can on-balance volume work with other indicators?
Yes. On balance volume is often paired with other indicators to confirm market direction by measuring buying and selling pressure in relation to price charts.
Disclaimer: Trading digital assets involves risk and may result in the loss of capital. Always do your own research. Terms, conditions, and regional restrictions may apply.


