
Alphabet Inc. on Bitunix: How to Trade GOOGLUSDT
Learn what Alphabet is and how to trade GOOGLUSDT on Bitunix. Explore Google stock forecast themes, Alphabet AI stock narratives, earnings catalysts, and beginner trading basics.

Crypto trading requires tools that help traders cut through volatility and identify reliable signals. One of the most trusted and widely used indicators is the Moving Average Convergence Divergence (MACD). Developed by Gerald Appel in the late 1970s, MACD is a trend-following momentum indicator that highlights changes in strength, direction, and duration of price movements.
In the fast-paced world of digital assets, the MACD indicator is especially useful for spotting entry and exit points, confirming trends, and managing risk. This guide explains what MACD is, how it works, and how traders can apply it effectively in crypto markets with the help of Bitunix’s advanced trading features.
[ez-toc]

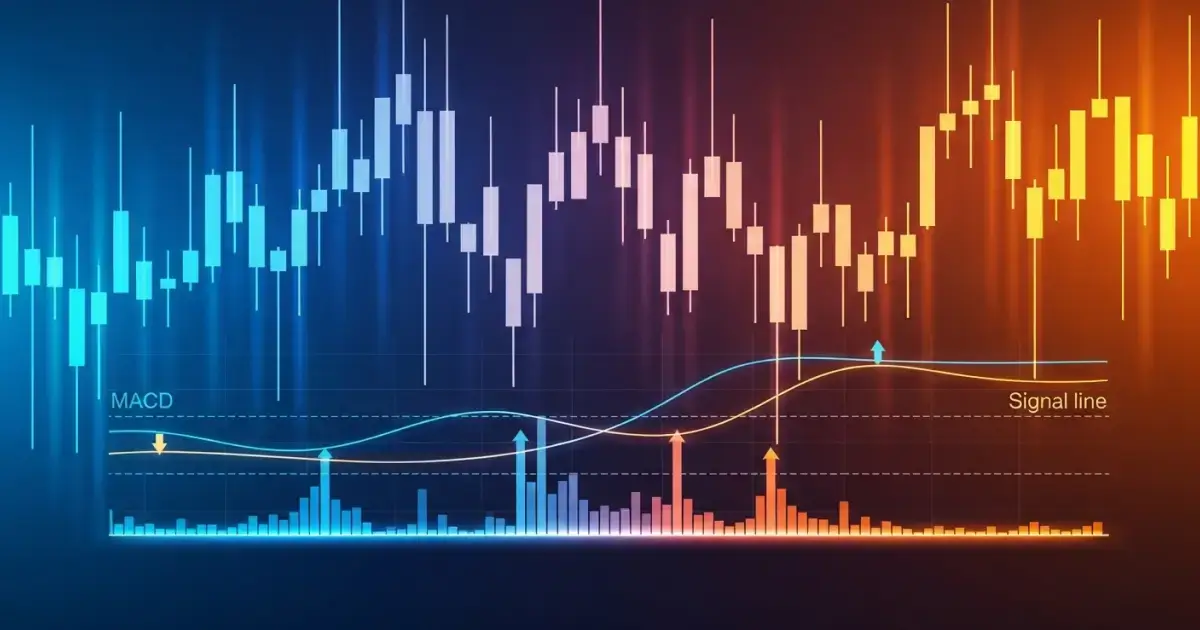
The MACD indicator is based on moving averages, specifically exponential moving averages (EMAs), which place more weight on recent prices. It consists of three components:
Traders use the interaction between these components to analyze momentum shifts and confirm trend strength.

The histogram grows as the distance between the MACD line and signal line increases. A rising histogram suggests strengthening momentum, while a shrinking histogram indicates weakening momentum.

The default MACD settings are 12, 26, 9, which work well in many markets. However, crypto traders sometimes adjust settings to suit shorter timeframes due to volatility:
On Bitunix charts powered by TradingView, traders can customize MACD settings to match their strategy.

Watch for histogram bars shrinking toward the zero line. This often signals weakening momentum and a possible trend reversal.
Combining MACD with RSI provides stronger confirmation. For example, if MACD gives a bullish crossover and RSI shows oversold conditions, the probability of a profitable trade increases.

The MACD indicator is powerful on its own, but execution and analysis tools make it more effective. Bitunix provides traders with features designed to optimize MACD-based strategies:
These tools allow traders to connect analysis directly to execution, ensuring they can act on MACD signals without delay.
What are the best MACD settings for crypto trading?
The default 12, 26, 9 works well, but traders often adjust to faster settings like 5, 13, 9 for short-term trading.
Is MACD reliable in volatile markets?
MACD can be effective, but it should be combined with other indicators to reduce false signals in highly volatile conditions.
Can MACD be used for futures trading on Bitunix?
Yes. MACD strategies work in both spot and futures markets. Futures traders often rely on shorter settings and quick execution.
How do MACD divergences help traders?
Divergences between MACD and price often signal weakening trends and potential reversals, giving traders an early advantage.
How does Bitunix help traders apply MACD strategies?
Bitunix offers TradingView charts, advanced order tools, alerts, and copy trading features to make MACD strategies easier to implement effectively.
The Moving Average Convergence Divergence indicator remains a cornerstone of technical trading. By identifying momentum shifts, confirming trends, and spotting divergences, MACD gives traders the ability to navigate volatile crypto markets with more confidence.
Although MACD is not foolproof and can generate false signals in sideways conditions, its reliability increases when combined with other tools and strong risk management.
With Bitunix’s charting, order management, alerts, and futures integration, traders can apply MACD strategies more effectively and with greater precision. Whether you are a beginner or an experienced trader, MACD remains one of the most important tools to master in crypto trading.
Disclaimer: Trading digital assets involves risk and may result in the loss of capital. Always do your own research. Terms, conditions, and regional restrictions may apply.


