
How AAPLUSDT Trading Works on Bitunix
Learn how to trade Apple stock on Bitunix with USDT, understand how AAPLUSDT works, and explore volatility, leverage, and risk management for beginners.
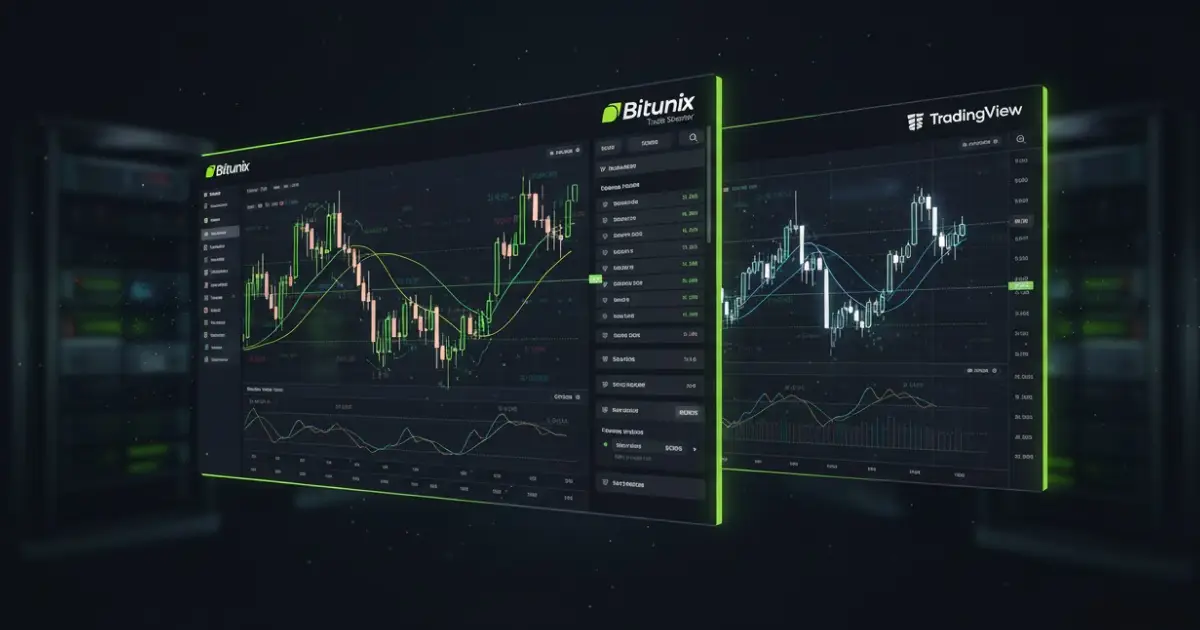
The crypto market runs nonstop. Prices move while you sleep, and opportunity does not wait for the opening bell. That is why charting matters so much in crypto. Identifying trends and gaining actionable insights is crucial for making informed trading decisions. Strong chart tools help you turn noise into structure so you can plan trades instead of chasing candles. On Bitunix you get a fast execution panel next to a clear chart canvas. Users can access advanced features and insights by creating an account. Pair that with TradingView for deeper study and alerts, and you have a simple, repeatable workflow from research to order placement.
If you are comparing the best live crypto charts, you will usually end up weighing three things. Some platforms offer full access to advanced charting tools and data for a subscription fee. First is the native exchange chart where you execute, often integrated directly with major exchanges. Second is TradingView where you do most of your analysis and alerting. Third is a small set of focused crypto analysis tools for scanning and journaling. Keep the setup simple. Your attention is the real edge here.
Create an account and start trading to access these features and take advantage of the latest insights and trends.
[ez-toc]

Crypto is volatile, liquid, and open around the clock. A good chart lets you answer basic questions quickly. Is the market trending or ranging. Understanding trends is essential for developing effective trading strategies, as it helps traders identify market direction and optimize their decisions. Where are obvious support and resistance zones. How wide is the average daily range. When you can answer those questions at a glance, your trade plan becomes much easier to execute.
Bitunix presents price, depth, and the order ticket on one screen. That keeps you close to the chart when it is time to act. TradingView adds a rich environment for testing ideas, setting alerts, and keeping a clean watchlist. Technical indicators help traders better understand market movements and refine their trading strategies. Together they cover most needs without a tangle of windows.

Load a pair, pick a timeframe, and you are ready to go. You can use the workspace to track your favorite pairs and manage your portfolio efficiently. Candles render cleanly. Zooming feels smooth. Drawing levels and trend lines is straightforward. You can switch layouts in a click and move from spot to perpetuals without losing your bearings, using filters to quickly find the assets or timeframes you want to analyze. Because the order ticket sits next to the chart, you can place a limit order directly at a level you marked, then set your stop and target without jumping tabs. That is a small time saver that adds up.
Quick tips for day one:

TradingView is where many traders do their heavy lifting. You can build watchlists, apply indicators, draw levels, and turn written rules into automated alerts. If you code, Pine Script lets you test and refine ideas. AI-powered tools can provide actionable insights and analyze large amounts of data to inform your trading strategy. If you do not code, you can still keep a clean routine and let alerts call you back when price reaches your area.
A sensible starter stack that uses the best indicators to use for cryptocurrency looks like this:
The goal is not to fill the screen. It is to support decisions. Use only what you can explain in one sentence.

A good workflow is boring on purpose.
This method fits beginners and scales to pros. It is also a great way to compare crypto charting and cryptocurrency trading tools without getting overwhelmed.

These drawing tools can be used to analyze different coins and tokens, compare token performance, and even help you spot hidden gems in the market by identifying promising setups early.
Keep drawings tidy. You want a fast read, not a wallpaper of lines.
If you later automate, convert your written entry rules into simple on-chart labels so you reduce guesswork. This keeps your crypto tools working for you rather than stealing your attention.
Trading bots can use technical indicators to automate your trading strategy, allowing a trading bot to execute trades more efficiently and consistently than manual trading.
K-Line Ultra focuses on clarity. Wicks are crisp, candles are clean at any zoom, and drawing feels natural. You can quickly view key metrics like market cap and track price action by date for any asset. These small details matter when you are placing a limit order right at a prior wick or when you are dragging a stop just beyond a zone. If you are exploring the best live crypto charts, judge them by how easy it is to read and act in fast conditions.
Chart-side placement is a quiet edge. Set a limit at your level, drop your stop to invalidation, and map partial targets. If you switch to market because the move is already underway, review slippage and spreads afterward. Making timely buy decisions can help you maximize profit and track your gains over time. That post-trade review helps you decide if a market order was worth it or if you should wait next time.
You do not need to watch every candle. Setting alerts for important news or price signals allows you to stay informed even while you rest. Set alerts at levels you care about. For example, price crosses above yesterday’s high, price retests a breakout, or RSI reclaims a key threshold in an uptrend. Alerts serve swing traders and part-time traders well. Plan during calm hours, act only when the market touches the plan.
A minimal dashboard goes far. Keep a watchlist of three to five liquid pairs, a simple heat read, and a notes pane for your key levels. You can also track stocks, NFT projects, and blockchain-based assets within your dashboard to monitor a diverse range of opportunities. If you are technical, you can build a small internal page with a few lightweight charts. If not, keep it simple inside TradingView and the Bitunix workspace. Most wins come from clarity, not from more windows.
Good crypto trading tools should make risk management easy. On Bitunix you choose isolated or cross margin, define your per-trade risk, and use stop market for certainty of exit. Your account and assets are protected by platform safeguards, and a complete risk management approach can help you maximize revenue. Keep a journal and tag trades by setup. Over a month you will see which rules actually pay and which ones you can drop. That is how you improve without adding complexity.
Breakout swing
Mean-revert scalp
These are simple patterns that teach discipline, sizing, and review habits. Incorporating these workflows into your overall crypto trading strategy helps you manage trades more effectively. By applying clear trading strategies, you can organize, monitor, and adjust your positions for better results.
What makes Bitunix charts useful if I already use TradingView?
Use TradingView for deep analysis, testing, and alerts. Use Bitunix for execution with a responsive K-Line chart and an order ticket that sits beside your drawings. The split is simple. Research there, act here. Bitunix also offers free features available to all users, making it accessible for both new and experienced investors.
Which indicators should a beginner start with?
Keep two or three. A 20 and 50 EMA for short-term bias, a 200 SMA for the higher timeframe, and RSI for momentum. Add ATR when you want to size positions with less guesswork.
How do I avoid analysis paralysis Pick one layout for research and one for execution. Limit your indicator stack. Review weekly. Remove anything that does not improve results in your own journal. You can also sign up for platform updates or newsletters to stay informed and avoid missing important changes.
Can I automate parts of this?
Yes. Use alerts to reduce screen time. If you code, use a simple script to label your written signals. Keep automation small at first so you can see what is working.
What is the fastest way to improve my chart reading?
Take screenshots of entries and exits. Mark the reason, the stop, and the result. Review twenty trades at the end of the week. Patterns jump out when you look at them side by side.
Where can new investors and customers find tutorials?
New investors and customers can find tutorials on the Bitunix platform, including step-by-step guides and educational resources designed to help you get started with crypto trading, technical analysis, and portfolio management. These tutorials are available for free to support your learning and success.
You do not need a complicated setup to trade well. One solid Bitunix layout for execution and one TradingView layout for research will carry you a long way. Keep drawings clean. Use a small, repeatable indicator stack. Let alerts protect your attention. Start small, document what you do, and let your own results decide which tools stay on your screen. That is how you build skill in a market that never sleeps.
Disclaimer: Trading digital assets involves risk and may result in the loss of capital. Always do your own research. Terms, conditions, and regional restrictions may apply.


