Crypto Weekly Market Overview: Another all-time high of 106,000 is a new rally or a precursor to a correction?
Market Overview
1. The price of Bitcoin broke through $106,000, a record high
On December 16, the price of bitcoin broke through the $106,000 mark for the first time, reaching a record high of $106,495.73.
The rally was driven by a number of factors, including:
Continued support from institutional investors: MicroStrategy, the world’s largest bitcoin holder and a U.S. software company, was included in the NASDAQ 100 index, indicating the increased recognition of crypto assets in mainstream financial markets.
Aggressive action by large holders (whales): Large whales reportedly transferred about $2.8 billion worth of bitcoin from exchanges to private wallets, indicating their optimism about the long-term value of bitcoin.
2. The United States plans to establish a strategic reserve of Bitcoin, which has sparked heated discussions in the market
U.S. President-elect Donald Trump has said that he plans to establish a “U.S. Strategic Reserve for Bitcoin,” similar to the Strategic Petroleum Reserve, to deal with possible financial uncertainty in the future. This idea sparked heated discussions in the market and was seen as one of the catalysts for the rise in the price of Bitcoin.
Market analysts believe that the move could further boost Bitcoin’s mainstreaming and elevate its status as digital gold.
The above events show that the cryptocurrency market is receiving more attention and recognition, and market sentiment is high. However, investors should remain cautious and pay attention to market volatility and potential risks.
[maxbutton name=”Start Trading”]
Popular Currencies and Quotes
- Bitcoin (BTC): The price is around $106,495, a record high, up 12.3% from the previous week.
- Ethereum (ETH): The price is around $4,275, up about 7.8% for the week, driven by rising demand for smart contracts.
- Litecoin (LTC): The price is around $139.84, up 3.6% from the previous week, thanks to the growth of applications in the payments space.
- Binance Coin (BNB): The price is around $742.50, up about 2.6% during the week, supported by the growth in trading volume on the Binance platform.
- Cardano (ADA): The price is around $1.19, up 4.9% for the week, with increased DeFi activity in its ecosystem.
- Ripple (XRP): The price is around $2.45, up slightly by 2.04% during the week, driven by positive factors from the court ruling.
- Dogecoin (DOGE): The price is around $0.456, up about 5.3% during the week, and social media buzz has picked up.
- Solana (SOL): The price is about $238, up about 8.6% during the week, supported by the active multi-chain application ecosystem.
- Polkadot (DOT): The price is around $10.02, up 4.9% during the week, with demand for cross-chain solutions driving price growth.
- Chainlink (LINK): The price is around $26.75, up 7.9% during the week, as demand for Oracle expands.
Market Analysis
This week, the cryptocurrency market led the rally by Bitcoin, breaking through the $106,000 mark, indicating the continued inflow of mainstream funds. At the same time, cryptocurrencies that support DeFi and NFT ecosystems, such as Ethereum, Solana, and Chainlink, also performed well, indicating the market’s optimistic expectations for related applications.
Fear & Greed Index
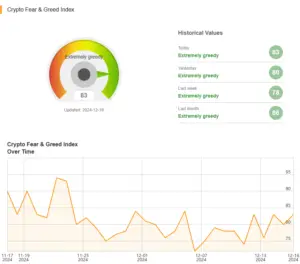
Sentiment was 83 on Tuesday, compared to 78 last week. BTC hit an all-time high of 106,000 again, and the fear index also continued to rise, from an unprecedented 94 when it broke through 98,000 on November 22 this year, and then retraced to 92,000.
Good news
- Policy support for economic growth: On December 9, the Political Bureau of the Central Committee of the Communist Party of China (CPC) held a meeting to emphasize the implementation of moderately loose monetary policy, promote economic transformation and upgrading, and provide strong support for the expansion of domestic demand.
- Measures to boost consumption: On December 16, the relevant responsible comrades of the Central Finance Office said that they will implement special actions to boost consumption, focusing on promoting the consumption of bulk commodities such as automobiles and home appliances, which is expected to drive the market demand of related industries.
- Financial Market Stability: On December 13, the National Financial System Work Conference emphasized the prevention and resolution of financial risks and the promotion of the stable and healthy development of the capital market, which will help enhance investor confidence.
- Central bank holdings of gold: The People’s Bank of China’s gold reserves increased to 72.96 million ounces by the end of November, indicating the importance of safe-haven assets such as gold, which could boost market sentiment.
[maxbutton name=”Start Trading”]
Bad news
- Economic data was lower than expected: Financial data for November showed that M2 growth fell year-on-year, and new credit increased by about 500 billion yuan year-on-year, indicating that the effect of credit easing was less than expected, which may have a negative impact on market sentiment.
- Bond yields fall: On December 16, the yield on 30-year Treasury bonds fell below 2% intraday, indicating that the bond bull market is continuing and may divert some investment in risky assets such as equities.
- Intensified market volatility: With the recent A-share market volatility and adjustment, led by the ChiNext index, investors need to be wary of short-term market volatility risks.
This week, it is advisable to focus on
Tuesday, December 17
- UK Employment Data
The unemployment rate for October will be released, providing an update on the UK labour market.
- Eurozone Economic Sentiment Index
The December ZEW Economic Sentiment Index will be released, reflecting investors’ confidence in the Eurozone economy.
- U.S. Retail Sales Data
Core retail sales for November will be released to measure U.S. consumer spending.
- Canadian Inflation Data
The core consumer price index (CPI) for November will be released, reflecting the level of inflation in Canada.
Wednesday, December 18
- UK Inflation Data
The annual rate of consumer price index (CPI) for November will be released, showing the inflation situation in the UK.
Thursday, December 19
- Federal Reserve Interest Rate Meeting
The Federal Reserve will hold an interest rate meeting, and the market expects a possible 25 basis point rate cut, and investors will focus on its guidance on the future path of monetary policy.
U.S. Stock Market Trends
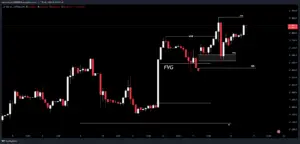
Two-hour candlestick chart of the US 100. We can analyze the market based on the SMC concept.
After hitting a new high last Wednesday, the backtest FVG hit another new high on Friday, and it is clear that the current market is in a fairly optimistic situation, and according to market expectations, the probability of a hard landing for the US economy in 2025 next year is low.
[maxbutton name=”Start Trading”]
Cryptocurrency Data Analysis
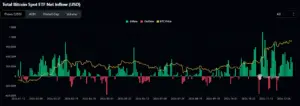
Analysis From December 9 to December 16
Net Inflow
- As can be seen from the chart, between December 9 and December 16, the Bitcoin spot ETF showed a steady net inflow. The green bar chart did not grow significantly during this period, but it also maintained net inflows, indicating that investors continue to use cryptocurrencies as part of their asset allocation.
- The net inflows may reflect the market’s confidence in Bitcoin and spot ETFs, especially as investors are bullish on Bitcoin’s future performance on the back of some positive news, such as the possible relaxation of crypto regulations by US regulators.
Bitcoin Price
- The yellow line shows that the price of Bitcoin remained relatively high in December and continued to hit new highs. The increase in net inflows may have further supported the stability of Bitcoin’s price.
- The rise in prices and the continuous inflow of funds have formed a mutually supportive relationship, that is, the buying power of the market has helped to maintain the price level of bitcoin.
Market Sentiment & Trends
- Looking at the trend across the chart, net inflows in December were not significantly higher than in previous months. The inflow of funds indicates that the market’s sentiment towards bitcoin is stable, but it has not lost confidence because it is at an all-time high.
Summary
During the week of December 9 to December 16, the net inflow of funds into the Bitcoin spot ETF did not increase significantly, but it also remained at the level of net inflows, reflecting the demand in the market and investor confidence in Bitcoin.
The continued net inflows also supported the price of Bitcoin, keeping it high during this period. In the future, investors can focus on the sustainability of capital flows and whether there will be further positive market news to drive price increases.
Bitcoin Market Analysis
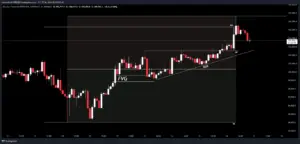
Bitcoin trends from December 9th to December 16th, based on market structure and SMC concept insights into the market.
Comprehensive Analysis
During the period from December 9th to December 16th, BTC broke through the historical high again after the shock, the same operation logic, we maintain the range operation logic between last week’s high and low, the discount range is long and the premium range is short, and the ETF continues to have a net inflow, which increases the support for BTC.
Bitcoin Futures Market Data
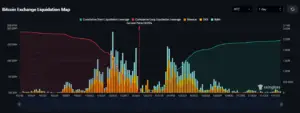
Analysis on the left (lower price range)
- The right side of the chart shows the cumulative liquidation of short positions (green curve), and the left side of the chart shows the cumulative forced liquidation of long positions (red curve) (the different colors of the histogram represent different trading platforms, such as Binance, OKX, Bybit, etc.).
- When the price moved from around $105,505, there was a gradual increase in short positions, especially in the range of $105,729 to $107,521. This means that when the price reaches these ranges, the stop loss of the short position is triggered, resulting in a large number of short positions being closed.
- As the price rises further, the cumulative short position continues to grow, indicating that the short position is gradually being cleared out of the market as the price rises.
- There is a considerable amount of long liquidation under the current market price, and 102,033 has a higher long closing volume, as we can see in the technical analysis chart, these prices will be the preferred price of the main institutions. This means that when the price reaches these ranges, the stop loss of the long positions is triggered, resulting in a large number of long positions being closed.
[maxbutton name=”Start Trading”]
Conclusion
We can focus on these liquid prices, and when there is no sign of turning after the trigger, this will be a good trading opportunity.

