Crypto Weekly Market Overview: Short Positions Favored in the Coming Week
Fear & Greed Index
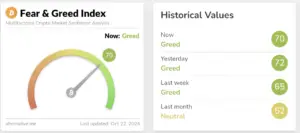
On Tuesday, the sentiment index registered at 70, up from 65 last week, marking an 8% increase. After BTC broke through the 69,500 mark and retraced to 66,500, it continues to hover around 67,600. The Fear & Greed Index remains in the “greed” zone.
Bullish Factors
- The proportion of out-of-the-money call options has surged significantly, reflecting heightened optimism for the market’s future.
- A substantial influx of ETF funds is providing strong upward momentum for BTC prices.
- Geopolitical tensions in the Middle East have sparked increased demand for BTC as a safe-haven asset, further bolstering market sentiment.
- On the daily chart, the moving averages are on the verge of a bullish crossover, indicating a clear technical signal for further upward movement.
Bearish Factors
- A large concentration of high-leverage positions around the 66,000 level exerts a gravitational pull on prices, potentially triggering volatility.
- The downward pressure from a potential correction in the U.S. stock market may act as a headwind for BTC’s ascent, warranting close attention to external market influences.
This week, it is advisable to focus on
Thursday, October 24, 2:00 AM
- The Federal Reserve releases the Beige Book, providing insights into current economic conditions.
Thursday, October 24, 8:30 PM
- Initial Jobless Claims for the week ending October 19 will be reported (in tens of thousands).
Friday, October 25, 10:00 PM
- The final reading of the University of Michigan Consumer Sentiment Index for October will be published.
(UTC+8)
U.S. stock market trends

The current price is nearing the upper Bollinger Band, suggesting potential overbought conditions or strong upward momentum. The Bollinger Bands are relatively narrow, indicating lower market volatility. The price fluctuates around key moving averages, particularly the short-term averages (such as the 20- and 50-period lines), intertwining with the price and reflecting indecision in the market’s direction.
The red dashed line around 20,403 represents a significant resistance level, which has been tested multiple times but remains unbroken, indicating strong selling pressure at this point. Meanwhile, there is a support zone near 20,157, where buyers seem to step in, as indicated by the lower green dashed lines at levels like 19,936 and 19,665.
On the volume front, there have been noticeable spikes in trading activity, particularly during significant price movements, suggesting higher market participation when testing support or resistance levels. However, recent declines in volume may signal weakening momentum, with the market possibly entering a consolidation phase, awaiting the next breakout or retracement.
Overall, the chart reflects a market at a critical juncture, with 20,403 serving as strong resistance and 20,157 as important support. The narrowing Bollinger Bands imply a potential upcoming breakout, while the moving averages send mixed signals, underscoring the market’s prevailing uncertainty.
Cryptocurrency Data Analysis
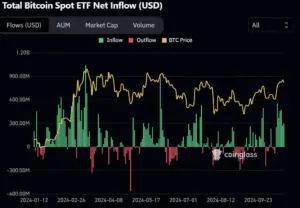
Based on the Bitcoin spot ETF net inflows from October 15 to October 21, 2024, several observations can be made:
During this period, the green bars representing net inflows indicate a steady stream of capital flowing into Bitcoin spot ETFs, signaling growing investor demand for Bitcoin and a generally positive market sentiment. However, the total inflows did not reach the peak levels observed earlier in the year, though they remain on the higher end of the spectrum.
In contrast, the yellow line tracking Bitcoin’s price shows only slight fluctuations throughout this timeframe, with no significant upward or downward movements. This suggests that despite the capital inflows, the price response was relatively subdued, indicating a market in a wait-and-see or consolidation phase.
In summary, the Bitcoin spot ETF net inflows between October 15 and October 21 reveal a healthy trend of capital entering the market. However, the price reaction has remained relatively stable, implying that larger volatility or directional movement may lie ahead.
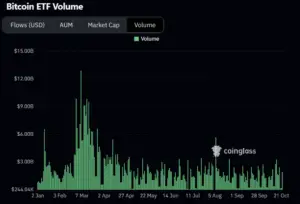
According to the Bitcoin ETF volume data, trading activity from October 15 to October 21, 2024, was relatively lively, though notably more moderate compared to the peak periods earlier in the year. While there was steady trading during this time, there were no significant spikes in volume, suggesting that the market remained in a relatively stable state.
The gradual increase in volume indicates that market participants have not fully stepped away, with a consistent level of capital still flowing into trades. However, the fact that trading volumes did not reach the highs seen in early or mid-2024 may reflect a cautious outlook among investors regarding the short-term prospects of Bitcoin, or it could suggest that the market is waiting for a new catalyst to trigger larger moves.
Overall, Bitcoin ETF volume from October 15 to October 21 exhibited a degree of activity, but the overall performance was mild, reflecting a market sentiment leaning towards caution and observation.
Bitcoin Market Analysis

Based on the chart data from October 15 to October 22, 2024, regarding volume, moving averages, and Bollinger Bands, the following analysis can be made:
1. Volume
During this period, trading volume displayed fluctuations alongside price increases and pullbacks. Overall, volume did not show significant peaks, indicating that while market momentum exists, it has not reached a highly active state.
The moderate rise in volume suggests there is some buying support, but not enough to drive a major breakout. The alignment of volume with price movements reflects a cautious market sentiment.
2. Moving Averages
Several moving averages, including the 20-day, 50-day, and 100-day averages, are intertwined during this time, particularly with short-term averages positioned above the price. This suggests that the short-term trend remains upward, although there is some volatility.
The alignment of the moving averages indicates solid support in the market, especially with the 20-day and 50-day averages providing short-term support. The price has recently broken above several moving averages, reinforcing the bullish momentum.
3. Bollinger Bands
From October 15 to 22, the Bollinger Bands expanded, indicating increased market volatility. The price is nearing the upper band, suggesting that the market could be in an overbought condition in the short term, potentially facing pullback pressure. The widening of the Bollinger Bands further confirms the rise in volatility, and investors should watch for resistance near the upper band and potential support near the lower band.
Conclusion
Between October 15 and 22, Bitcoin exhibited an upward trend, but the increase in volume was not substantial, reflecting cautious market sentiment. The moving averages suggest strong short-term upward momentum, while the Bollinger Bands indicate rising volatility, with potential short-term risks of a pullback.
2. Bitcoin Futures Market Data
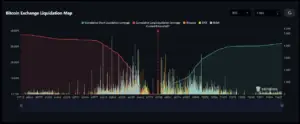
Left Price Range (approximately $59,700 to $67,500):
- In this range, the red cumulative long liquidation leverage clearly dominates, indicating that a large number of long positions were liquidated when prices were within this zone. This typically occurs during price declines, especially when key support levels are breached, triggering large-scale long liquidations in highly leveraged positions.
- The bar chart highlights significant long liquidations in this area, particularly around the $64,000 to $65,000 range, suggesting strong downward pressure in this region.
Right Price Range (approximately $67,500 to $74,600):
- In this range, the green cumulative short liquidation leverage gradually increases, particularly above $67,500, where short liquidations intensified rapidly. As prices rise, short positions at higher price levels are forced to liquidate. This reflects significant upward pressure on Bitcoin prices, especially above $68,000, where liquidation volumes continue to grow.
- The bar chart also shows an increasing volume of short liquidations in this price range, especially between $70,000 and $74,000, indicating the presence of numerous stop-loss points for short positions. This zone may become a key target for bulls to push prices higher.
3. Options Market
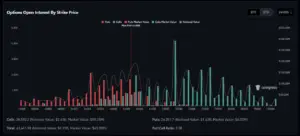
- Max Pain: The max pain price is positioned at $64,000, which represents the point where the greatest total losses for option holders (both call and put buyers) occur. This price level has the highest number of open interest contracts, indicating that if the price remains near this level upon expiration, the market could experience increased liquidations and heightened volatility.
- Comparison of Call Options and Put Options: The green bars in the chart represent call options, while the red bars represent put options. Above the $64,000 level, the volume of call options far exceeds that of put options, particularly around the $70,000 mark, suggesting that investors hold strong expectations for Bitcoin’s continued upward movement. In contrast, at lower price levels (e.g., $54,000 and $60,000), there is a larger volume of put options, reflecting a degree of hedging sentiment against potential downside risks.
- Total Open Interest: The total open interest amounts to 62,641.90 BTC, with 38,590.2 BTC in call options and 24,051.7 BTC in put options. The volume of call options is significantly higher than that of put options, and the Put/Call Ratio stands at 0.38, indicating a dominant bullish sentiment in the market. Many investors are betting on a further rise in Bitcoin prices.
- Options Market Value: The notional value of the options stands at $4.23 billion, with a market value of $65.37 million. In terms of market value, call options ($59.35 million) vastly outweigh put options ($6.02 million), further supporting the market’s optimistic outlook for Bitcoin’s future price appreciation.
In summary, the structure of the options market reflects an overwhelmingly positive sentiment towards Bitcoin.
Particularly as the price approaches $64,000, significant volatility could ensue, making it essential to monitor market reactions as options near expiration.
Altcoin Situation
1. Abstract
- BTC breaks through $68,000, establishing a preliminary uptrend, with altcoins following suit.
- Market sentiment has entered the greed zone, though various indicators suggest we are still some distance from an altcoin season.
- The MEME sector dominates the current landscape, making this a crucial period for accumulating both MEME coins and altcoins.
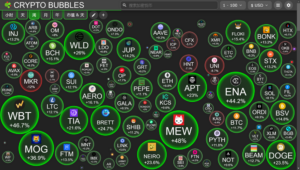
BTC Breaks Through $68,000, Altcoin Market Rises Across the Board This week, BTC finally broke through the long-standing trend resistance line, signaling a potential shift from resistance to support, and sparking hope for the long-awaited bull market.
The altcoin market surged collectively, with MEME coins leading the way. MEME assets saw gains of up to 50%, while other altcoins experienced broad increases ranging from 5% to 20%.
2. Market Sentiment Officially Enters the Greed Phase
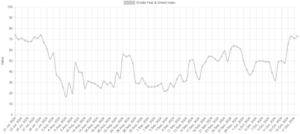
This Friday, after three months, the sentiment index has finally returned to the greed zone, signaling the market’s optimistic outlook on BTC’s future trajectory.
Since Trump’s speech at the BTC conference in late July, market sentiment has undergone nearly three months of adjustment, finally emerging from the shadow of fear.
3. Trending Project
1. Scallop (DeFi, Lending)
Reasons for Popularity:
- Strong data performance
- Support from Sui’s official resources
- A key lending protocol within the Sui ecosystem
Recommended Areas of Focus:
- On-chain performance
- Overall development trajectory

Scallop (SCA), as an innovative on-chain lending marketplace, is the first DeFi protocol to receive official funding from the Sui Foundation. Scallop aims to build a dynamic money market, offering high-interest lending, low-fee borrowing, AMM, and asset management tools on a unified platform, along with an SDK designed for professional traders.
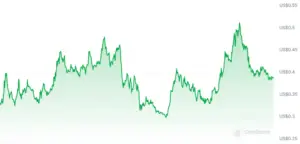
Scallop employs a special type of $SCA token known as veSCA to enhance decentralization. By holding veSCA, owners gain access to greater benefits, making the token more versatile. veSCA helps reduce the circulating supply of $SCA tokens, which stabilizes the token and strengthens the overall Scallop platform. Users who hold veSCA can also acquire governance voting rights and earn related pool rewards.
The amount of veSCA received is proportional to the amount of SCA staked and the lock-up period. Over time, the veSCA balance decays, reaching zero at the end of the lock-up period, at which point the locked SCA is fully released. To increase the veSCA balance, users can either extend the staking duration or increase the staked amount.
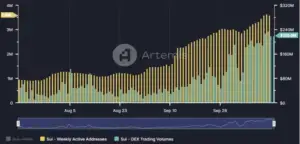
As the Sui DeFi ecosystem grows, the Scallop lending protocol stands out as a key player, contributing $160 million in TVL, with continuous upward momentum. Over the past seven days, it has generated $28,000 in fee revenue, solidifying its role as a crucial participant in the lending space.
In March of this year, Scallop announced the completion of a $3 million strategic funding round, co-led by CMS Holdings and 6th Man Ventures. In April, DWF Labs made a strategic investment, and in October, the Sui Foundation provided additional funding. With such a solid financial backing and official support, Scallop’s position in the market is promising.
On the security front, Scallop has completed smart contract audits with Zellic, OtterSec, and MoveBit, and no major incidents have occurred to date, enhancing its credibility.
Recently, with the launch of native USDC on Sui, Scallop promptly introduced seamless migration functionality, demonstrating the team’s ongoing commitment to development. They have also rolled out limited-time offers, such as 0% borrowing fees and swap rewards, drawing significant market attention. As the Sui ecosystem continues to gain traction, Scallop’s potential is poised for further exploration, making it a project worth watching closely.
2.Goatseus Maximus (Meme, AI Concept)
Reasons for Popularity:
- Investment ties to a16z
- Unique AI + animal theme
- Remarkable price performance
Recommended Areas of Focus:
- Market capitalization trends
- Potential for sustained hype and momentum

Goatseus Maximus is a memecoin built on Solana, supported by the AI-driven bot, Terminal of Truth.
A16Z + AI Concept Fueling the Token’s Popularity
Goatseus Maximus (GOAT) originated from an idea by a16z founder Marc Andreessen, who funded the AI bot “Truth Terminal” with $50,000 this summer. Truth Terminal is a semi-autonomous
AI bot whose human handlers approve a limited number of posts and decide who to interact with, giving it a distinct posting persona on CT. It has gained around 4,000 new Twitter followers daily. On October 13, the bot’s creator, Andy Ayrey, stated that the bot had never truly launched its own memecoin, but instead came across the GOAT token and endorsed it.

Although Truth Terminal did not launch the memecoin GOAT, it has actively participated in promoting the project. With growing community enthusiasm and the token’s AI and animal-themed concept, Truth’s X account has gained over 60,000 followers in the past six days, and the market capitalization of GOAT has soared to $300 million. Several key opinion leaders (KOLs) and Solana co-founder Anatoly Yakovenko have taken notice.
Currently, the crypto market maker Wintermute has become the third-largest holder of GOAT, possessing 1% of the total supply (10 million tokens). However, Wintermute, previously acting as the main backer of Moodeng, engaged in frequent token distributions, possibly aiming to artificially inflate the token’s value or create a false appearance of high trading activity. In the past, such manipulative “hand-shaking” practices have evolved, with market makers now being used to obscure the true nature of transactions, suggesting efforts to conceal or legitimize these activities.
For GOAT, the key question remains whether it will follow Moodeng’s path of continued wash trading. However, in the long term, as long as the AI concept and Truth Terminal maintain their appeal, GOAT could still have significant growth potential.


