Crypto Weekly Market Overview: The Start of a Surge or the Peak of the Mountain?
Fear & Greed Index
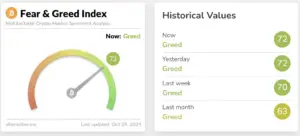
This Tuesday, the sentiment index climbed to 72, a 3% increase from last week’s 70. With BTC breaking through the 71,000 mark, the Fear & Greed Index remains firmly in the “Greed” zone, reflecting a heightened market optimism and anticipation of further gains.
Bullish Factors
- The share of out-of-the-money call options in the options market has risen significantly, indicating a strong bullish sentiment.
- Large capital inflows into ETFs are providing support for further price increases.
- Heightened tensions in the Middle East have strengthened BTC’s appeal as a safe-haven asset, boosting demand.
- Daily moving averages are on the verge of forming a bullish crossover, signaling a potential upward trend.
Bearish Factors
- A large number of high-leverage positions are concentrated around the 66,000 level, creating a strong gravitational pull on the price.
- The pressure from a potential U.S. stock market correction could act as a headwind for BTC’s upward momentum.
This week, it is advisable to focus on
Wednesday, October 30 at 20:15
- U.S. October ADP Employment Change (in tens of thousands)
Thursday, October 31 at 20:30
- U.S. Initial Jobless Claims for the week ending October 26 (in tens of thousands)
- U.S. September Core PCE Price Index YoY
Friday, November 1 at 20:30
- U.S. October Unemployment Rate
- U.S. October Non-Farm Payrolls (seasonally adjusted, in tens of thousands)
(All times are UTC+8)
U.S. stock market trends

The current price is fluctuating within the Bollinger Bands, reflecting an overall sideways consolidation. After recently touching the upper band, the price has retraced and is now hovering near the middle band, indicating short-term corrective pressure.
In the moving average system, short-term averages (such as the 5-day and 10-day) are closely following the price trend, suggesting a lack of clear market direction and a more pronounced oscillatory pattern.
In terms of trading volume, there have been multiple surges, showing significant buying and selling interest at specific price points. These volume spikes may represent entry and exit activity by short-term traders rather than a strong trend-driving force. If the price continues to move near the middle band with declining volume, it could signal a consolidation phase.
A breakout above or below the Bollinger Bands could then spark a new wave of volatility.
Going forward, monitoring the moving average crossovers and potential breakouts at the Bollinger Band edges, alongside volume changes, will provide insights into the likely direction of price movement.
Cryptocurrency Data Analysis
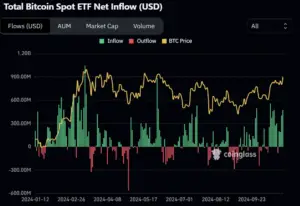
From October 22 to October 28, 2024, the net inflows (in green) and outflows (in red) of Bitcoin spot ETFs are as follows:
- Increased Net Inflows: During this period, the green bars representing ETF net inflows are notably prominent, indicating heightened demand for Bitcoin purchases. This increase in inflows suggests growing investor interest in Bitcoin, potentially driven by shifts in market sentiment or other favorable factors.
- Price Performance: The price of Bitcoin (yellow curve) maintained a steady upward trend throughout this period, reflecting how the rising ETF inflows have bolstered Bitcoin’s price, contributing to a gradual ascent. The inflows have provided the momentum needed for this steady price rise.
- Impact of Market Sentiment: The strengthened net inflows during this time may be influenced by global economic or policy factors, such as heightened tensions in the Middle East, which have amplified Bitcoin’s appeal as a safe-haven asset. Thus, this continuous inflow of capital is likely to support Bitcoin’s price upward.
In summary, from October 22 to October 28, the substantial net inflows into Bitcoin spot ETFs, accompanied by a steady price increase, indicate a bullish market sentiment and sustained buying interest in Bitcoin.
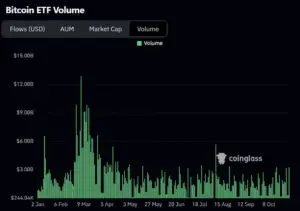
Here is an analysis of the Bitcoin ETF trading volume from October 22 to October 28:
- Volume Trend: During this period, trading volume remained relatively low, far below the peak levels seen in March. Although there were minor fluctuations, no significant surges in trading activity were observed.
- Stability: Trading activity showed relatively stable, modest fluctuations, indicating that interest in Bitcoin ETF trading remained steady throughout the week without any notable increase or decrease.
- Market Sentiment: The subdued trading volume may suggest that the market is in a wait-and-see or consolidation phase, with investors potentially holding back until clearer market signals or major news emerge before increasing their trading activity.
Bitcoin Market Analysis
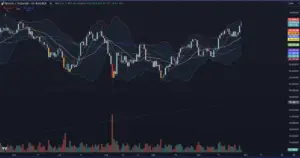
The Bitcoin price trend from October 22 to October 28 can be analyzed through three key indicators: moving averages, Bollinger Bands, and trading volume.
Moving Averages: Short-term moving averages (such as the 5-day and 10-day) are trending upward and positioned above the longer-term moving averages, forming a clear bullish alignment, indicating an uptrend in the market.
The price trading above these moving averages further reinforces a short-term bullish signal, with the alignment of the moving averages providing strong support for Bitcoin’s upward trend.
Bollinger Bands: The Bollinger Bands are gradually widening, reflecting increased market volatility. After breaking above the middle band in late October, the price has stayed close to the upper band for several days, showcasing strong upward momentum.
This behaviour typically signals robust buying pressure, especially when the price remains near the upper band, suggesting that market momentum remains strong.
Trading Volume: Trading volume has increased in tandem with the price rise, indicating growing buy-side interest as the price ascends, adding credibility to the upward movement. The rising volume further supports the price uptrend, highlighting active investor participation.
Overall, from October 22 to October 28, Bitcoin’s price action shows a strong uptrend. The bullish alignment of moving averages, the breakout along the upper Bollinger Band, and the increase in trading volume all reflect a market sentiment favouring the bulls and a dominant buying force.
2. Bitcoin Futures Market Data
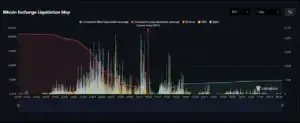
Based on the chart, the analysis by left and right price ranges is as follows:
Left Price Range (Approximately $63,700 to $68,000):
- Dominance of Long Liquidations: In this price range, cumulative long liquidation leverage, marked in red, is notably dominant, indicating a large number of long positions were liquidated when the price was in this zone.
This typically occurs during price declines, especially when the market breaks through key support levels, triggering liquidations of highly leveraged long positions.
- Distribution of Liquidation Volume: The bar chart shows a particularly high volume of liquidations in the $64,000 to $65,000 region, reflecting strong downward pressure in this area. This could be due to a concentration of stop-loss points for long positions, intensifying the price decline.
Right Price Range (Approximately $68,000 to $74,600):
- Increasing Short Liquidations: As the price moves above $68,000, cumulative short liquidation leverage, shown in green, starts to increase, with a significant rise above $70,000. As the price climbs, short positions are forced to cover at higher levels, indicating a gradual easing of bearish pressure in this range.
- Concentration of Liquidation Volume: Observing the bar chart, there is a notable increase in short liquidation volume between $70,000 and $74,000, suggesting that this range may contain numerous stop-loss points for shorts, potentially becoming a target for bullish momentum. If the price breaks through this zone, the cascading effect of liquidations could further fuel an upward price movement.
3. Options Market
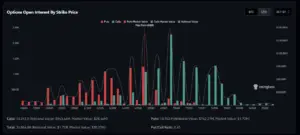
From the chart, we can observe the distribution of open interest in Bitcoin options by strike price:
- Put/Call Ratio: The current Put/Call ratio stands at 0.45, indicating a dominant bullish sentiment in the market, as the volume of open interest in call options far exceeds that of put options. This suggests that investors are leaning toward expectations of a price increase.
- Key Strike Price: A large concentration of open interest is clustered around the $68,000 strike price, designating this level as the “Max Pain” point. At this price, the losses for both call and put buyers would be maximized, making it a potential target level around expiration as market forces may attempt to keep prices near this zone.
- Strike Price Distribution: In addition to $68,000, there are also significant concentrations of call open interest near $70,000 and $75,000, reflecting strong bullish expectations at these levels. If Bitcoin’s price begins to approach these levels, it could trigger further upward momentum.
Overall, the market outlook for Bitcoin remains optimistic, particularly above $68,000, where the substantial open interest in call options could provide additional upward pressure on the price.
Altcoin Situation
Goat Tops the Trending List

Truth Terminal, an AI bot, now holds over a million dollars in Goat tokens. It has befriended “a16z” founder Marc Andreessen, who once provided $50,000 in Bitcoin support to the bot. In a podcast, Marc also discussed Truth Terminal’s origin and the creation of the meme coin GOAT, describing it as “the first true fusion of AI and cryptocurrency.”
Following Binance’s announcement on the 24th to launch the GOATUSDT perpetual contract, GOAT surged briefly past 0.9 USDT, with its market cap exceeding $900 million at one point. This solidified its leading position in the AI + “meme” space, making it the first token launched by “pump.fun” to reach such a valuation and to be listed on Binance contracts.
Ape Gains Popularity
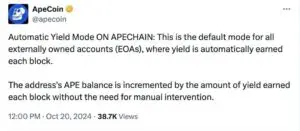
On October 20, ApeChain’s official cross-chain bridge, based on Arbitrum Orbit L3, went live on the mainnet. Users can bridge tokens like ETH and “APE” to ApeChain, where stablecoins bridged to ApeChain are converted to DAI and stored in sDAI, earning yields at MakerDAO’s savings rate.
ApeChain has also launched Ape Express, a meme launch platform similar to Pump.fun. The wealth effect has transformed ApeChain into the latest battleground for Meme PvP:
One wallet address made a striking gain on the ApeChain meme project CURTIS, turning a $1,140 investment into a $2.55 million profit.
The user began buying just one and a half minutes after deployment, spending a total of 1,520 APE ($1,140) to acquire 13.14% of CURTIS’s total supply (131.4 million tokens). They currently hold 11.08% of CURTIS (110.8 million tokens), now valued at $2.55 million.

