
Crypto Weekly Market Overview: When Will the Pullback End, or Has It Already Ended?
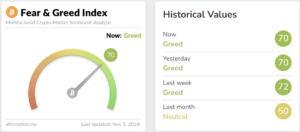
Fear & Greed Index
This Tuesday, the sentiment index stands at 70, a 3% increase from last week’s 72. Although BTC has fallen below 68,000, the Fear & Greed Index continues to reflect a state of greed.
Positive News
- U.S. Bitcoin Spot ETF sees inflows of $2.22 billion: This significant capital inflow underscores growing investor confidence in Bitcoin’s role as a financial asset, signaling a potential shift in institutional engagement and broader market adoption of cryptocurrency.
- Franklin Templeton launches tokenized U.S. Treasury fund on the Base chain: Asset management giant Franklin Templeton has introduced FOBXX, a tokenized U.S. Treasury fund on the Base blockchain, marking a deeper integration between traditional financial assets and blockchain technology, and opening new pathways for asset tokenization.
- Circle CEO emphasizes the potential of stablecoins: At Binance Blockchain Week, Circle CEO Jeremy Allaire highlighted the untapped potential of stablecoins, projecting they could capture 10% of the global electronic money market within the next decade. This statement brings positive expectations for the cryptocurrency market as a whole.
Negative News
- U.S. nonfarm payrolls fall short of expectations: October’s nonfarm payrolls saw a mere 12,000 new jobs, marking the lowest increase since the pandemic began. This unexpected figure has heightened concerns over the economic outlook, potentially casting a shadow on sentiment in the cryptocurrency market.
- Immutable receives Wells notice from the SEC: Web3 gaming platform Immutable has received a Wells notice from the U.S. Securities and Exchange Commission, alleging violations of securities laws. This regulatory action has led to a decline in the price of its token, IMX, highlighting the risks regulatory scrutiny poses to the crypto market.
- Bitcoin price volatility: After failing to reach a new all-time high, Bitcoin’s price has pulled back from $73,000 to around $69,000, reflecting increased market volatility. Investors are advised to approach with caution amidst these fluctuations.
Key Events to Focus on This Week
Tuesday, November 5
- The United States will hold its 2024 presidential election, a pivotal event likely to have widespread implications across global markets.
Thursday, November 7 at 21:30 (UTC+8)
- Initial U.S. jobless claims for the week ending November 2 will be released. This data offers a fresh perspective on the country’s employment landscape and may influence economic sentiment.
Friday, November 8 at 03:00 (UTC+8)
- The U.S. Federal Reserve will announce its interest rate decision, setting the upper limit for rates as of November 7. This decision could have profound impacts on financial markets worldwide, shaping investor expectations for the months ahead.
U.S. stock market trends
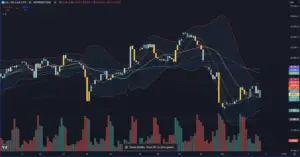
US 100 (Nasdaq 100 Index) 2-Hour Candlestick Chart Analysis
Moving Averages Analysis
The chart includes several moving averages, likely covering 5, 10, 20, 50, 100, and 200 periods, each representing price averages over various timeframes.
-
- Short-term moving averages (such as the 5- and 10-period) are currently intertwined with the price, indicating a lack of clear short-term direction.
- Medium- and long-term moving averages (such as the 50- and 100-period) are trending downward, suggesting that the broader market sentiment remains bearish.
- Price is lingering below these longer-term averages, unable to break through resistance, signaling a strong overhead barrier.
Volume Analysis
-
- The volume histogram shows a significant spike on October 24, coinciding with a sharp decline, indicating heavy selling pressure and a strong bearish sentiment at that time.
- During the subsequent rebound, volume gradually diminished, revealing insufficient momentum to support the recovery. Selling pressure has eased, yet buying interest remains muted.
- Recent candlesticks display a renewed increase in volume, which could signal another round of selling or heightened volatility, urging investors to closely monitor the interplay between price and volume.
Bollinger Bands Analysis- The wide distance between the Bollinger Bands’ upper and lower bands reflects increased volatility in recent sessions.
- Price found support near the lower band and rebounded toward the middle band, yet it failed to break through, indicating persistent weakness.
- Currently, price is oscillating between the middle and lower bands, with a slight narrowing of the bands, suggesting the market may be entering a phase of consolidation or limited-range movement in the near term.
Overall Analysis
In summary, the US 100 index appears to be in a consolidation phase with a bearish bias. Short-term moving averages show a lack of direction, while medium- and long-term averages exert downward pressure.
The resistance at the middle Bollinger Band, coupled with subdued volume during the rebound, suggests a lack of bullish momentum. Investors are advised to approach with caution, noting support around the 20,100-point level and resistance near 20,500 points. A significant volume-driven break above the middle band could signal a potential further rally.
Cryptocurrency Data Analysis
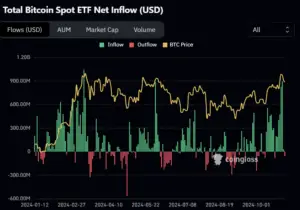
Analysis for October 29 to November 4
Net Inflows
-
- The chart shows strong net inflows into Bitcoin spot ETFs during the period from October 29 to November 4, as indicated by the marked increase in green bars. This rise in inflows reflects heightened investor interest in Bitcoin, with many directing capital towards spot ETFs during this time.
- The increased inflows may indicate growing market confidence in Bitcoin and spot ETFs, especially amid positive news, such as the potential approval of more spot ETFs by U.S. regulatory authorities. This optimism signals a more favorable outlook for Bitcoin’s future performance.
Bitcoin Price
-
- The yellow line illustrates that Bitcoin’s price remained relatively high from late October to early November, close to its yearly peak. This increase in inflows likely bolstered the stability of Bitcoin’s price during this period.
- The price rise and sustained inflows created a mutually supportive relationship, with steady buying interest helping to uphold Bitcoin’s price level.
Market Sentiment and Trend
- The trend in the chart indicates that net inflows at the end of October and beginning of November were significantly higher than in previous months, suggesting growing optimism toward Bitcoin.
- These capital inflows may also be driven by macroeconomic uncertainties or volatility in other financial markets, prompting investors to allocate funds toward Bitcoin and similar digital assets.
Summary
During the week from October 29 to November 4, Bitcoin spot ETFs saw a notable increase in net inflows, reflecting strong demand and investor confidence in Bitcoin.
This continued inflow has supported Bitcoin’s price, keeping it at elevated levels during this period. Looking ahead, investors may wish to monitor the sustainability of these inflows and watch for further positive market developments that could drive prices even higher
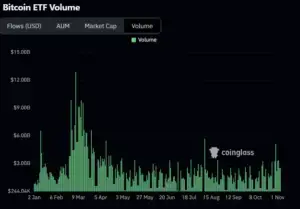
Analysis of October 29 to November 4
- Volume Changes
-
- During the period from October 29 to November 4, trading volume saw a noticeable increase compared to previous weeks. The green bars indicate rising activity, suggesting a growing interest in Bitcoin ETFs.
- This surge in volume may have been influenced by recent fluctuations in Bitcoin’s price. Higher trading volume often reflects stronger market sentiment and increased investor participation.
- Market Sentiment
-
- The rise in volume generally indicates heightened attention from market participants, especially with Bitcoin’s price holding at elevated levels. This suggests that investors may be anticipating further price increases.
- Elevated trading volume signals a positive market sentiment, likely aligned with investors’ bullish outlook on the market’s future.
- Relationship with Fund Inflows
-
- When viewed alongside the previous data on fund inflows, the simultaneous increase in volume and net inflows indicates new capital entering the market and heightened trading activity.
High trading volume is often a sign of active capital movement, which may also signal the onset of a more volatile phase in the market.
Summary
Between October 29 and November 4, Bitcoin ETF trading volume rose significantly, reflecting increased investor attention and engagement. This trend suggests positive market sentiment, with the potential to support Bitcoin’s price at high levels or even drive further gains.
Investors should closely monitor subsequent volume changes to assess whether market sentiment will continue to strengthen.
Bitcoin Market Analysis
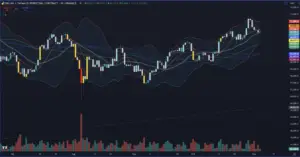
Bitcoin Price Analysis from October 29 to November 4: Volume, Moving Averages, and Bollinger Bands
- Volume Analysis
- From the volume histogram, we observe that trading volume during October 29 to November 4 remained relatively steady, with no significant spikes or dips. This even volume distribution suggests a cautious market sentiment, as investors seem to be awaiting clearer directional signals.
- The lack of notable volume surges, either upward or downward, indicates a balanced power between buyers and sellers, and that the market lacks a decisive trend during this period.
- Moving Averages Analysis
- The chart includes multiple moving averages (such as the 5-day, 10-day, and 20-day), and since October 29, Bitcoin’s price has remained above the shorter-term averages. There were, however, several instances where it touched or approached these short-term support levels, indicating that the market is testing these supports.
- The mid-term moving averages (like the 50-day) lie below the current price, offering solid support, while the long-term averages (such as the 100-day and 200-day) are also trending upward at a slower pace, reflecting an overall upward trend.
- During this timeframe, the price neither decisively broke through the upper resistance of the short-term averages nor fell below key supports, a pattern typical of a consolidating market.
- Bollinger Bands Analysis
- The Bollinger Bands narrowed during the period from October 29 to November 4, indicating decreasing volatility and a possible accumulation phase.
- Price movement near the middle band suggests a lack of clear directional breakout in the short term.
- If the price manages to break above the upper band in the near future, it could signal the beginning of a bullish trend. Conversely, a drop below the lower band, especially with increased volume, could suggest a bearish move.
Overall Analysis
During October 29 to November 4, Bitcoin’s price oscillated around multiple technical support levels with little change in volume, suggesting the market is in a wait-and-see mode.
The moving averages provide some support, and the narrowing Bollinger Bands imply a potential breakout in the near future.
Trading Recommendations:
- If the price breaks above the upper Bollinger Band with increased volume, this could be a bullish signal, suitable for long positions.
- If the price falls below the lower Bollinger Band with a spike in volume, caution is advised as this may indicate a bearish trend.
Investors should closely monitor volume and potential Bollinger Band breakouts over the coming days to capture the next directional move.
2. Bitcoin Futures Market Data
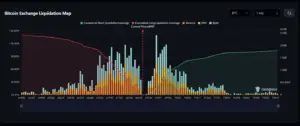
Analysis of the Left Side (Lower Price Range)
- The left side of the chart displays the cumulative short liquidation (green curve) and the short liquidation volume across various price levels (indicated by bars in different colors, representing platforms like Binance, OKX, Bybit, etc.).
- As the price rises from around $61,852 to near $68,000, short liquidations gradually increase, with a particularly high concentration between $66,000 and $68,000. This indicates that as the price reached these levels, stop-losses for short positions were triggered, resulting in significant short liquidations.
- With further price increases, the cumulative short liquidation volume continues to rise, suggesting that short positions are increasingly forced out as the price climbs.
Analysis of the Right Side (Higher Price Range)
- The right side shows cumulative long liquidations (red curve) and long liquidation volume across different price levels. Between $70,000 and $76,000, there is a gradual increase in long liquidations.
- Notably, as the price approaches the current level of around $69,957, long liquidations become more frequent, indicating some pressure on long positions in these higher price zones. If the price pulls back from these highs, it could lead to further long liquidations.
- As the price continues to rise, the pressure from long liquidations gradually decreases. However, near the $75,000 mark and above, there is still a risk of substantial long liquidation pressure forming, which could act as a barrier to further upward movement.
In summary, the lower price range reflects a clearing out of short positions as prices rise, while the higher price range indicates increased pressure on long positions, especially if the price faces resistance around current levels or above. This dynamic reveals potential support near $66,000-$68,000 and resistance closer to $75,000.
3. Options Market
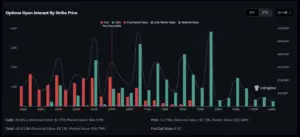
Bitcoin Options Open Interest by Strike Price: Analysis
- Max Pain
- The chart indicates a max pain point at $67,000. This is the strike price where open interest from both buyers and sellers reaches an equilibrium. At max pain, option sellers benefit the most, as the expiring options hold minimal value for buyers.
- If the market price approaches $67,000 close to expiration, it could minimize losses in the options market, potentially causing the price to gravitate toward this level.
- Distribution of Call and Put Options
- Call Options (Green Bars): Open interest for call options peaks around $67,000, indicating that many bullish investors expect or hope for the price to reach this level. Additionally, there is substantial open interest for call options at $70,000, $80,000, and $90,000 strike prices, reflecting strong market expectations for further upside in Bitcoin’s price.
- Put Options (Red Bars): The open interest for put options is relatively low and is primarily concentrated at strike prices below $67,000. This suggests that investors have a weaker expectation of a price decline, with less demand for downside protection.
- Put/Call Ratio
- The Put/Call ratio stands at 0.37, meaning that the open interest for call options significantly outweighs that for puts. A low Put/Call ratio generally implies bullish market sentiment, with investors optimistic about Bitcoin’s price potential.
- This ratio also reflects a stronger presence of bullish positions relative to bearish ones, particularly near the max pain level of $67,000, indicating an optimistic outlook.
- Potential Support and Resistance Levels by Strike Price
- The $67,000 to $70,000 range holds considerable open interest in call options, suggesting it could act as a short-term support level as many bulls expect the price to remain above this zone.
- Conversely, high open interest for call options is also present around $80,000 and $90,000, which could serve as potential targets or resistance levels for bulls. If Bitcoin’s price surpasses $70,000, it might continue to advance towards $80,000 or higher.
Overall Analysis
- Market Sentiment: The distribution of open interest indicates a bullish sentiment, with a low Put/Call ratio suggesting that investors expect further upward movement in Bitcoin’s price.
- Max Pain Influence: The max pain point at $67,000 implies that, as expiration approaches, the price could drift toward this level to minimize potential losses in the options market.
- Support and Resistance Levels: The $67,000 level may act as a key support, while $70,000, $80,000, and $90,000 serve as potential upward targets and resistance levels.
In the short term, investors should monitor whether Bitcoin maintains support around $67,000 and watch for potential breakout opportunities above $70,000.
Altcoin Situation
Popular project – 「BAN」
This week, a new angle has emerged in the world of meme tokens: PvP (Player vs. Player) with an artistic twist. According to monitoring from Lookonchain, Michael Bouhanna, the Vice President of Sotheby’s, has gained attention due to his involvement with meme tokens.
Previously, Bouhanna invested in several meme tokens with limited success. However, using a wallet beginning with “5W7U,” he launched a new meme token called BAN. Through an internal wallet transaction,
Bouhanna reportedly earned over $1 million from BAN. Although he later destroyed 37.36 million BAN tokens in response to mounting pressure, he was able to profit from BAN through strategic internal wallet purchases.

The continued enthusiasm for meme tokens, particularly BAN, is largely due to the powerful wealth effect. For instance, a “smart money” address acquired 80.77 million BAN tokens for just 2.97 SOL (around $518) during the BAN’s early trading stage and amassed a profit of $1.25 million—a remarkable 2,414x return.
This address, likely an “Alpha Hunter,” has traded 80 different tokens over the past week with a win rate of 60%, profiting through low-cost entries and quick sales of new or low-market-cap tokens. This strategy has already yielded $177,000 in profits. Of course, it’s also possible that this person is an insider for various projects.
Another key driver behind the popularity of meme tokens could be “airdrop hunters”. The anticipation of new tokens like Pump has intensified. According to The Block, pump.fun recently hinted at an upcoming token launch in X Spaces. Gate.io has already announced the start of pre-OTC trading for Pump.fun (PUMPFUN) on October 30 at 23:30.

Beyond just token issuance, pump.fun has introduced significant product updates, including a new advanced trading terminal called Pump Advanced.
This platform offers features like charts, top holder statistics, advanced filters, real-time update threads, and more. The site also supports login via Privy, a user verification platform, and allows the use of non-custodial wallets. For the first 30 days, users can enjoy a 0% fee on transactions.

