
Crypto Weekly Market Overview: Is the Rate Cut Euphoria Over or Just Beginning?
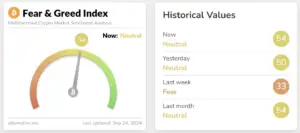
Fear & Greed Index
This Tuesday, the sentiment index stands at 54, a 64% increase from last week’s 33. With BTC surging to near 64,000 and now hovering around 63,000, the Fear & Greed Index has shifted from fear to a more neutral stance.
Bullish Factors
- The Federal Reserve has cut rates by 50 basis points as expected.
- Bitcoin has formed a triple bottom structure and successfully breached the key support-resistance flip level at $62,000.
- Japan has decided to maintain its current interest rate policy.
Bearish Factors
- U.S. employment data has shown weakness, highlighting potential risks of an economic recession.
This week, it is advisable to focus on
Thursday, September 26th, 20:30 (UTC+8):
- U.S. Initial Jobless Claims for the week ending September 21st (in tens of thousands).
Friday, September 27th, 20:30 (UTC+8):
- U.S. Core PCE Price Index for August.
Friday, September 27th, 20:30 (UTC+8):
- U.S. Michigan Consumer Sentiment Index Final Reading for September.
[maxbutton name=”Start Trading”]
U.S. stock market trends
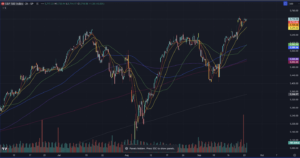
From this 2-hour chart of the S&P 500 index, the price is currently above 5,700 points and is in an upward trend. Several moving averages are intertwined, reflecting short-term fluctuations in the market.
The yellow (short-term) and red (medium-term) moving averages are currently supporting the price’s upward movement. However, there is visible resistance around the 5,720-point level, where the price has momentarily stalled.
In terms of volume, the previous upward momentum was accompanied by active trading, but recent volumes have declined, indicating a potential weakening of buying pressure. Under these circumstances, the market may enter a consolidation phase or face the risk of a pullback. However, if the price manages to break through the current resistance, it could continue its upward trajectory.
The Bollinger Bands indicate that the current price is nearing the upper band, suggesting the market may be in a short-term overbought state, increasing the likelihood of a pullback. While volume has fluctuated, there has not been a significant surge, indicating that market sentiment has yet to experience any dramatic changes.
Overall, the trend remains upward, but close attention should be paid to whether the price can effectively break through the resistance at 5,756.81. Failure to do so could lead to a retracement, potentially testing key support levels below. In summary, the index remains strong, but the outcome near the 5,720-point resistance will determine the short-term direction of the market.
Cryptocurrency Data Analysis
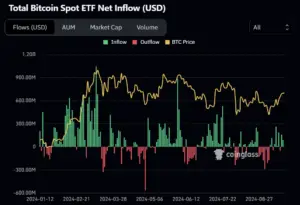
The chart reveals that between September 10 and September 24, the fund flows for Bitcoin spot ETFs remained relatively stable, showing a gentle trend of net inflows.
Although there were some outflows during this period (represented by red bars), inflows (green bars) predominantly prevailed. Notably, in the days leading up to September 24, the inflow volume increased compared to earlier, indicating a growing interest among investors.
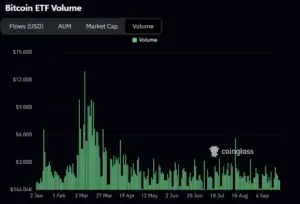
From September 10 to September 24, Bitcoin ETF trading volume remained relatively low, with no significant fluctuations or large-scale activity. Compared to the peak periods earlier in the year and in early March, current trading volume is still at subdued levels.
Although the chart shows occasional minor increases in volume, overall market activity has been fairly muted, with most of the time seeing low trading volumes. This likely reflects a cautious sentiment among investors, who appear to be waiting for clearer market signals or policy developments to guide their next moves.
[maxbutton name=”Start Trading”]
Bitcoin Market Analysis
1. Bitcoin daily chart
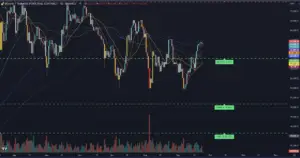
The chart shows that between September 10 and September 24, Bitcoin experienced an upward movement followed by a consolidation phase. The price faced resistance near $63,000, failing to break further, while support was found around $60,170 (-4.65%), a level that had previously provided effective support during past pullbacks.
Moving averages indicate that bullish momentum is weakening, and short-term price fluctuations or corrections may occur. Volume fluctuated during this period but remained relatively stable without any significant spikes or drops, reflecting cautious market sentiment.
The 5-day and 10-day simple moving averages are showing divergence, and without the support of the 21-day and 48-day simple moving averages in the upward channel, this appears to mark a short-term top. Over the next one to two weeks, a downward trend is likely, as the 12-hour chart also reveals various signs of volume-price anomalies. This current position does not favour an overly bullish outlook.
2. Bitcoin Futures Market Data
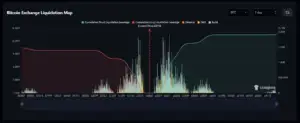
From this Bitcoin exchange liquidation chart, the current price near $63,110 represents a significant resistance level for short positions. As the price approaches this level, short liquidation leverage has increased sharply, indicating that a substantial number of short positions have been forced to close, placing considerable pressure on short sellers.
However, this may also signal that the price is nearing a short-term top, and as bullish momentum gradually weakens, short sellers could look for new entry opportunities in this price range. If the price fails to decisively break above $63,110, the market may experience a pullback, giving short sellers a chance to reassert pressure.
Short investors should closely monitor the price action at this critical level, waiting for momentum to fade and seeking an opportune moment to enter short positions.
3. Options Market
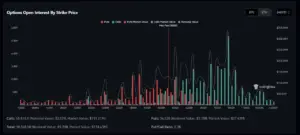
With Bitcoin currently priced at $63,000, the options open interest distribution chart reveals that call options significantly outnumber put options, particularly in the range above $60,000. This abundance of call options suggests a generally optimistic market sentiment, with expectations for further price increases.
However, for short sellers, this might present an opportunity. As the price approaches the “Max Pain” point at $58,000, the current level of $63,000 may face significant selling pressure. Especially if market sentiment shifts or a pullback occurs, the substantial number of call positions could face liquidation pressure.
Should the price fail to break through higher resistance levels, short sellers might find this peak a favorable point to position themselves, anticipating a retreat to lower support levels and aiming to capitalize on the potential market correction.
Altcoin Situation
1. Abstract
Altcoins Rebound Across the Board, Modular Blockchain Leads the Way Once Again
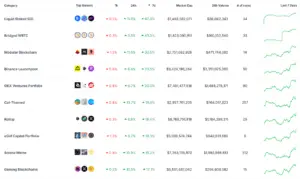
The altcoin market has seen a notable rebound, with most altcoins reversing their downward trend. This week, particular attention should be paid to the following sectors:
- Modular Blockchain: Modular blockchains have performed exceptionally well this week, with TIA, DYM, and SAGA showing significant gains.
- Binance Blockchain: Projects on Binance Launchpool have also experienced widespread gains, with SUI and AEVO drawing significant attention this week.
- Cat-Themed MEMEs: Once again, cat-themed MEMEs have made it to the top of the performance charts. These assets, often sensitive to Bitcoin price movements, have been mentioned previously as ones to watch.
Overall, this week’s market follows BTC’s upward trend, with little fundamental analysis driving specific sectors. Modular blockchains and cat-themed MEMEs have repeatedly topped the weekly gainers’ lists, indicating strong market-making activity. These two sectors, in particular, warrant close attention, while other high-performing tokens have also seen substantial gains.
2. This Week’s Market and Exchange Listings
Aleo, a “superstar” project that raised $200 million in its Series B funding, made its debut on MEXC but has only been listed on Coinbase among the major exchanges. Its token’s opening price was far below expectations, leading to significant losses for OTC traders and miners.
Besides the absence from larger exchanges, Aleo’s tokenomics also appears to be contributing to its price struggles. The initial supply consists of 1.5 billion tokens, with the consensus algorithm generating new tokens post-mainnet launch to reward validators and stakers.
Of the total supply, 34% is allocated to early backers, 25% to grants, ecosystem contributors, and education, 17% to employees and project contributors, 16% to the Aleo Foundation and Provable, and 8% to strategic partners. The official statement clarified that the tokens claimed will be subject to a 1-year lock-up period.

On September 13th, South Korean exchange Upbit announced the listing of Nervos Network’s “CKB,” supporting KRW, BTC, and USDT trading pairs. In response to this news, CKB surged over 70% within a week, demonstrating that the wealth effect of listings on Korean exchanges remains strong.
On September 15th, Binance announced the launch of “UXLINK” perpetual contracts, which led to a 60% price increase within 24 hours, briefly pushing UXLINK above 0.75 USDT.
On September 16th, Binance listed the Meme coin “Neiro” for spot trading, resulting in a 115.48% surge within just one hour. Shortly thereafter, Binance also launched Neiro contracts. In just three days, Neiro’s price had more than tripled. Binance’s impact on Meme coin prices and its “exchange-decides-the-winner” model have sparked intense discussions within the community.