
Crypto Weekly Market Watch: A Final Surge or a Last-Ditch Rebound?
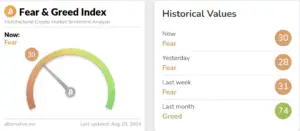
-Fear & Greed Index: This week, the market continues to hover in a state of anxiety.
Bullish Factors
- The high open interest in call options for year-end expirations remains robust.
- Bitcoin continues to oscillate within its trading range, with no signs of breaching the daily level M360.
- Significant gains in U.S. stocks could potentially drive Bitcoin prices higher in tandem.
Bearish Factors
- The U.S. government’s sale of 10,000 BTC has imposed considerable selling pressure on the market, which remains weak.
- A large concentration of options on August 30th within the $55,000–$52,000 range reflects the market’s cautious stance on this month’s price movements.
- An outflow of $81 million from BTC ETFs and a recent reduction in Bitcoin trading volume suggest that capital may be shifting to more stable markets, potentially exerting a substantial impact on the Bitcoin market.
-This week, it is advisable to focus on
Thursday August 22
2:00AM FOMC Minutes
8:30PM Initial Jobless Claims
Friday August 23
10:00 PM Fed Chair Powell Speech (UTC+8)
U.S. stock market trends
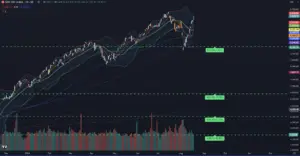
The recently released CPI data has decreased as anticipated, and the market has seemingly absorbed the crisis from early August’s sharp drop. U.S. stocks continue to rise broadly, with the S&P 500 Index ($SPY) now just about 2% shy of its all-time high. The U.S. market tends to climb with difficulty, but once it drops, recovery happens swiftly. Since August 5th, the market has shifted rapidly from one extreme to another. Based on historical experience, such dramatic fluctuations may indicate a significant retracement, followed by a continued rise to new highs before eventually starting to decline.
Cryptocurrency Data Analysis
Bitcoin Spot ETF Net Inflow and Volume (USD)
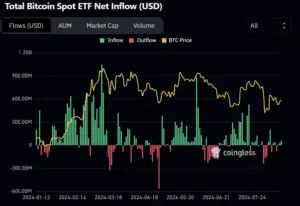
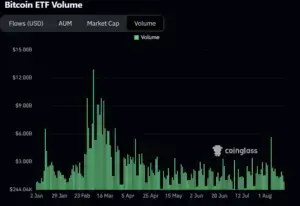
Current market behavior is primarily focused on the jockeying before the interest rate decision meeting, leading to frequent shifts between inflows and outflows. The main influencing factors are:
- Considerations for risk aversion.
- Weakened speculative sentiment due to last week’s choppy market movements with no clear trend, resulting in a higher number of cautious observers.
Bitcoin Market Analysis
1.Bitcoin daily chart
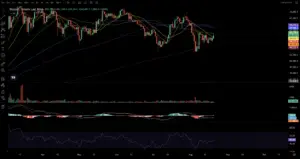
On the daily chart, the mid-term moving averages are gradually forming a bearish arrangement. Although Bitcoin is currently trading within a range-bound pattern, short-term caution is still necessary to guard against downward risks. In the long run, if the U.S. stock market continues to remain strong,
Bitcoin could potentially experience a rapid surge, aligning itself once again with the movements of the stock market. Conversely, if the stock market experiences a pullback after a strong rebound, Bitcoin may act as a leading indicator for stock market trends, with its current weakness signaling potential risks in the broader market.
2.Bitcoin Futures Market Data
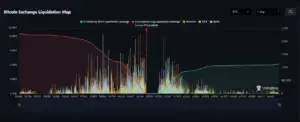
The current futures liquidation map reveals a significant accumulation of positions around the $59,000 to $60,000 range, which exerts considerable attraction on the price.
In contrast, short positions are concentrated in the $61,000 to $62,000 range. As a result, these two zones will become key battlegrounds in the near term. It is crucial to closely monitor any potential breakthroughs or breakdowns in these ranges.
3. Options Market
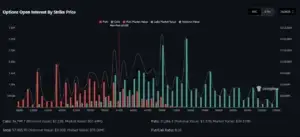
The chart illustrates the open interest in Bitcoin options by strike price, highlighting the distribution of puts (red) and calls (green) across various price levels. Notably, the largest concentration of open interest is observed around the $61,000 strike price, which also corresponds to the “max pain” point, where the total value of options contracts is at its peak.
This level represents a significant battleground in the market, with a high volume of both calls and puts. The total notional value is $3.50 billion, with a notable put/call ratio of 0.36, indicating a higher number of calls compared to puts. This distribution suggests that traders are anticipating potential upward movements, but the presence of significant puts also reflects underlying caution.
- Bitcoin technical analysis
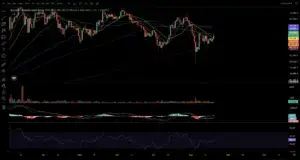
Bitcoin’s current position is quite precarious. The recent rise over the past two days appears to be purely a technical rebound, a release of the long-term pressure exerted by the 21-day simple moving average. While the 5-day simple moving average has crossed above the 10-day simple moving average, potentially forming a short-term bullish channel, this upward momentum may not last long.
The downward cross of the 89-day simple moving average below the 144-day simple moving average signals the end of a mid-term trend or the beginning of a mid-term correction. At this juncture, a bullish stance is reasonable, but caution is advised.
For those looking to short, there might not be a particularly favorable entry point this week, so it’s better to wait. If the risk of going long seems too high, consider reducing position size or opting for smaller positions. This week leans bullish, with a potential breakthrough of the 48-day simple moving average, possibly reaching the 89-day simple moving average.
Altcoin Situation
1.Trending Projects
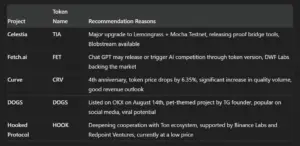
Five projects span across different sectors, each derived from market sentiment, yet all possessing a compelling narrative within their fundamentals.
The modular approach stands as the market’s rising star, offering substantial room for growth and development despite current technological imperfections. Celestia, as a representative project in the modular sector, holds the potential to lead the way. Following significant upgrades, it warrants continued long-term attention.
AI, though showing signs of fatigue, still captivates the market’s interest, particularly with the promise of fresh narratives such as GPT upgrades, new language models, and expanded application scenarios.
The merger of Fetch.ai, Ocean Protocol, and SingularityNET, initiated on July 1st, transitions AGIX and Ocean to FET, and subsequently to ASI. Upon the completion of this merger and upgrade, the project is poised to meet market expectations and fulfill the need for project capital recovery, potentially heralding further positive developments.
- Popular Projects

Sonic (A Layer-1 Platform with Ethereum Security Gateway)
Reasons for Popularity
The return of the core figure, Andre Cronje, who will serve as the Chief Technology Officer of Sonic Labs
The upgrade from Opera to Sonic
Suggestions for Attention
Monitor the development of the entire ecosystem following official support
Observe the performance of the tokens post-transition
Anticipate the formal launch of the Sonic network
Sonic is a Layer-1 platform equipped with an Ethereum security gateway, offering the fastest settlement layer for digital assets, with a TPS exceeding 10,000 and a transaction confirmation time of just one second.
Development History (From Fantom to Sonic Labs)
On August 2nd of this year, the official team announced the rebranding of Fantom to Sonic Labs, with plans to gain support through the introduction of a large-scale incentive program.
Sonic will use the S token, which will be integrated into the ecosystem through extensive airdrops, simplified staking, and incentive plans. While the transition from Fantom to Sonic Labs is complete, the official launch of Sonic is scheduled for Q4.
The Return of Andre Cronje
On August 14th, Sonic Labs (formerly Fantom) announced the appointment of Andre Cronje as Chief Technology Officer.
Andre will continue to lead the design and development of the new Sonic network, with a particular focus on the innovative native bridging technology, “Sonic Gateway,” which will enhance the security and convenience of transferring assets from other chains, such as Ethereum, to Sonic.


