Key Takeaways
- A candlestick chart visually displays an asset’s price movement within a specified time frame.
- Crypto candlestick charts highlight essential data such as the highest and lowest prices, as well as the opening and closing prices, capturing the overall price trend over time.
- These charts can help you analyze the performance of the crypto asset and reduce risk of capturing false positive signals.
What Is a Crypto Candlestick Chart?
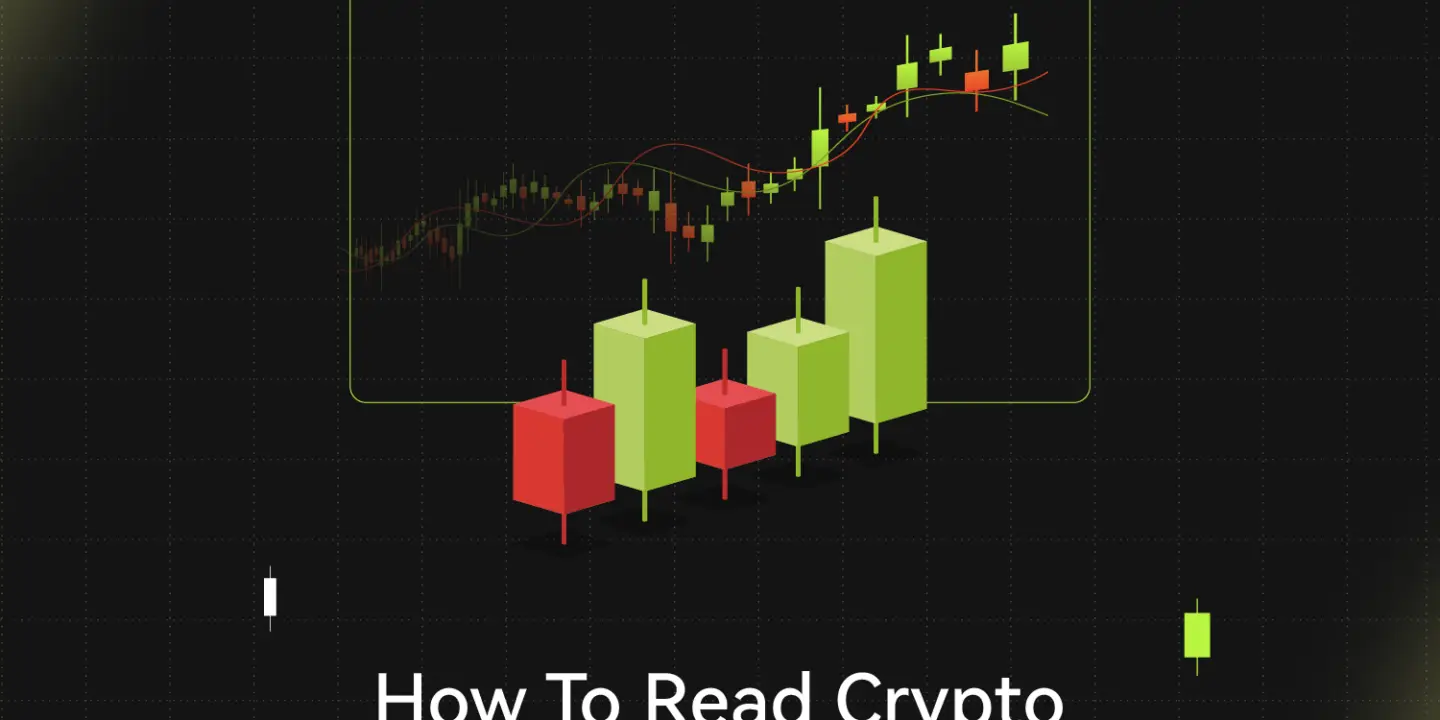
A crypto candlestick chart visually represents the trading activity of a digital asset over a selected period. It provides crucial information such as the asset’s opening price, closing price, highest point, and lowest point.
- Vertical axis: Displays the asset’s price.
- Horizontal axis: Represents time intervals (e.g., minutes, hours, days).
An asset’s candlestick chart showcases the real time price performance, including the trading price and the trading volume. Whether you’re a day trader or a long-term investor, understanding these charts can offer an edge in navigating the volatile nature of the crypto market.
Why Are Technical Indicators Important for Crypto Traders?
Technical indicators play a vital role in crypto trading because they provide data-driven insights into market behavior, helping traders make better decisions in the volatile cryptocurrency markets. Given the unpredictable nature of crypto assets, these indicators are essential tools to understand trends, momentum, and potential price reversals.
Following are the key reasons why technical indicators are crucial for crypto traders
Identify Trends and Market Direction: Crypto markets experience frequent and often dramatic price fluctuations. Trend indicators, such as Moving Averages (MA) or Moving Average Convergence Divergence (MACD), help traders identify the direction of the market—whether an asset is in an uptrend, downtrend, or moving sideways. Knowing the market’s direction allows traders to align their trades with the prevailing trend, increasing the probability of success.
Detect Entry and Exit Points: Technical indicators help pinpoint the best moments to enter or exit a trade. For example: RSI (Relative Strength Index) can reveal if an asset is overbought or oversold, signaling a good opportunity to buy or sell.
Bollinger Bands highlight when prices are at extremes, helping traders decide when to enter or exit during volatile periods. These insights allow traders to time their trades more effectively and maximize profits while reducing losses.
Confirm Market Movements and Trends: Indicators like the On Balance Volume (OBV) or MACD confirm whether the price movements are supported by trading volume and momentum. For example,
if a price increase is accompanied by rising volume (as indicated by OBV), it confirms the strength of the trend. Conversely, low volume during price rises may warn that the trend is weakening, alerting traders to a potential reversal.
Adapt to Volatile Market Conditions: Given the crypto market’s 24/7 trading cycle and frequent price swings, it’s important for traders to adapt quickly. Indicators like the Exponential Moving Average (EMA) are particularly useful because they react faster to recent price changes, allowing traders to adjust their strategies in real-time.
What are Candlesticks in Crypto Trading?
The Candlestick’s Real Body
Each candlestick on the chart represents a specific time period, such as five minutes, one hour, or a day. The body of the candlestick, often called the real body, shows the difference between the opening and closing prices during that interval.
- Longer bodies indicate significant price changes.
- Shorter bodies suggest minimal movement during the period.
For example, if a candlestick covers the period from 9:00 am to 10:00 am, and the asset’s price opened at $100 and closed at $110, the difference of $10 would be reflected in the body’s length.
Candlestick Color: Bullish vs. Bearish
The color of each candlestick provides essential information about the price movement:
- Green candle: The price increased during the time frame, with the bottom of the body representing the opening price and the top representing the closing price (bullish).
- Red candle: The price decreased during the interval, with the top of the body indicating the opening price and the bottom showing the closing price (bearish).
The Wick or Shadow
Also called the tail, the wick extends above and below the real body and represents the highest and lowest prices reached during the period. For example, if the asset opened at $100, peaked at $150, and dropped to a low of $80 before closing at $120, the wick will display that price range, giving a clearer picture of the trading activity.
Best Indicators To Use For Creating Your Trade Set Up
Now that we know how candlesticks are formed, let’s understand some of the most crucial indicators that you must know to place your trades more effectively. Following are the indicators that you can combine with your larger trading strategy.
Relative Strength Index (RSI)
The RSI measures the speed and magnitude of price changes, helping traders determine whether an asset is overbought or oversold. It helps you determine whether an asset is overbought (above 70) or oversold (below 30), signaling a potential reversal.
Moving Averages (MA and EMA)
Moving Averages (MA) smooth out price fluctuations, helping traders identify trends more easily. Two common types used in crypto trading are:
- Simple Moving Average (SMA): A basic average of the asset’s price over a set period.
- Exponential Moving Average (EMA): Gives more weight to recent prices, making it more responsive to new trends, which is especially useful in fast-moving crypto markets.
Moving averages help traders spot trends and trend reversals, reducing noise from random price movements.
Bollinger Bands
Bollinger Bands consist of a moving average with two standard deviation lines above and below it. When the price moves outside the bands, it indicates:
- High volatility or a potential reversal.
- A price touching the upper band may signal that the asset is overbought.
- A price near the lower band may indicate that the asset is oversold.
This indicator helps traders anticipate price breakouts and identify periods of market volatility.
Moving Average Convergence Divergence (MACD)
The MACD is an indicator that compares two moving averages—typically a 12-day EMA and a 26-day EMA. The difference between these averages is plotted as a line, helping traders identify momentum changes.
- Positive MACD: Indicates upward momentum.
- Negative MACD: Suggests downward momentum.
When the MACD crosses above the signal line, it may indicate a buy signal. Conversely, a downward cross can signal a sell opportunity.
On Balance Volume (OBV)
OBV measures the volume flow to determine whether volume supports the current trend. If the price rises with high volume, it confirms the trend’s strength. Conversely, if volume decreases during a price rise, it may signal that the trend is weakening. OBV helps traders spot early trend reversals and confirm breakouts.
How to Apply Technical Indicators on Bitunix Trading Chart?
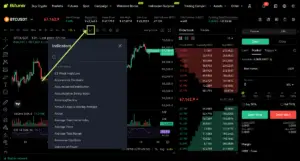
To use technical indicators, simply select the trade pair you wish to trade in. Let’s take BTC/USDT for example. Now, select the indicators icon (see image below)

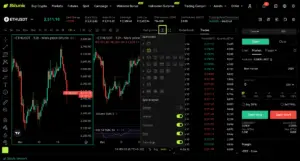
From the list of indicators, you can choose the indicator you wish to track. In the image above, we have selected RSI and SMA for BTC/USDT for the last 12 hours. You can use the multi chart window to track multiple indicators of the trade pair. Simply head over to the square icon and choose the layout you want to apply. (See image below)

Conclusion
Mastering crypto candlestick charts and indicators is essential for anyone looking to succeed in the volatile world of cryptocurrency trading. These charts offer valuable insights into an asset’s price trends, volatility, and market sentiment, helping traders reduce risks and make more informed decisions.
By combining candlestick patterns with key indicators like RSI, MACD, Bollinger Bands, and OBV, traders can refine their strategies and improve their ability to predict market movements. Whether you are a short-term trader or a long-term investor, understanding these tools will give you a critical edge in the ever-evolving crypto market.


