Article Summary
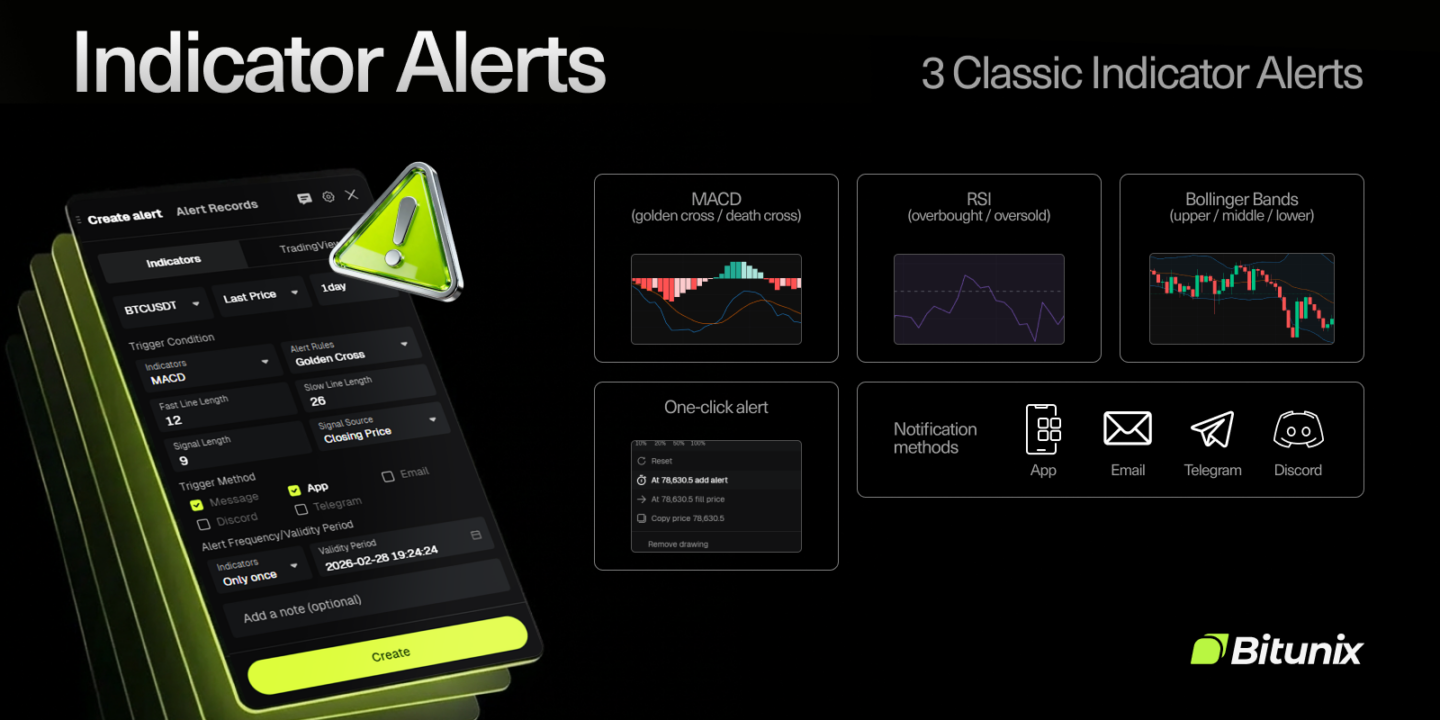
- Indicator Warning 1.0 is a built-in Bitunix alert system that helps you capture market anomalies using technical indicators and chart structure.
- You can create alerts based on MACD, RSI, and Bollinger Bands signals, including crosses, divergences, thresholds, and volatility changes.
- The feature also supports Drawing Alerts for support, resistance, and trendlines, plus Channel Alerts for zones such as parallel channels and range rectangles.
- Alerts can be configured with frequency (one-time or repeating), expiration time, monitoring price source, and clear naming for easier management.
- Notifications can be delivered through configured channels, which may include in-app alerts, email, and integrations such as Telegram and Discord.
Markets can shift in seconds. A clean alert at the right moment can be the difference between reacting late and acting on time. Indicator Warning 1.0 is a built-in chart alert system on Bitunix designed to help you spot market anomalies through technical indicators and chart structure, then notify you when your conditions are met.
Instead of watching charts nonstop, you can set alerts for key signals across indicators, drawings, and price zones, then receive notifications through your selected delivery method.
[ez-toc]
What Is Indicator Warning 1.0
Indicator Warning 1.0 lets you set alerts based on:
- Technical indicator signals
- Drawing tool levels such as support, resistance, and trendlines
- Price zones such as channels and ranges
- Personalized notification settings and delivery channels
The goal is practical: help you capture meaningful changes in momentum, volatility, and structure with less screen time and fewer missed signals.
What’s Included
Indicator Alerts
Create alerts tied directly to indicator conditions. This is useful for monitoring momentum shifts, trend transitions, and volatility changes.
Drawing Alerts
Create alerts on chart drawings such as line segments and trendlines. This is ideal for breakouts, pullbacks, and key level retests.
Channel Alerts
Create alerts when price enters, exits, or crosses a defined zone such as a parallel channel or a rectangle range.
Personalized Alert Configuration
Customize alert sound, duration, and delivery channel. Depending on your setup, alerts may be delivered via in-app notifications, email, or messaging integrations such as Telegram and Discord.
Supported Indicators and Alert Conditions
Indicator Warning 1.0 supports:
- MACD
- RSI
- Bollinger Bands
MACD Alerts
You can configure alerts for signals such as:
- Golden cross
- Death cross
- DEA crossing the zero line
- Top divergence
- Bottom divergence
Best for: momentum flips and divergence signals that can precede reversals.
RSI Alerts
You can configure alerts for:
- Threshold crosses (crosses through, crosses up through, crosses down through)
- Greater-than and lower-than threshold comparisons
Best for: momentum confirmation and overbought or oversold monitoring based on your preferred levels.
Bollinger Bands Alerts
You can configure alerts for:
- Overbought and oversold signals
- Middle band golden cross and death cross
- Bandwidth expansion and contraction
Best for: identifying volatility regime changes, including squeeze-to-expansion transitions.
How to Create an Indicator Alert on Bitunix
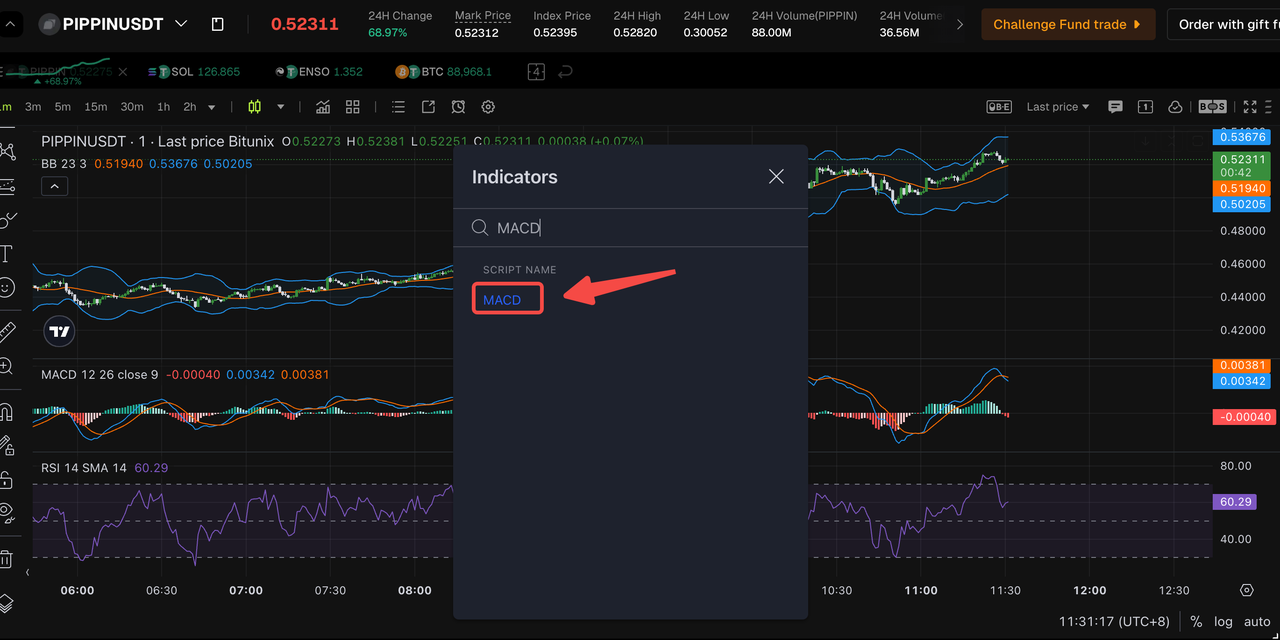
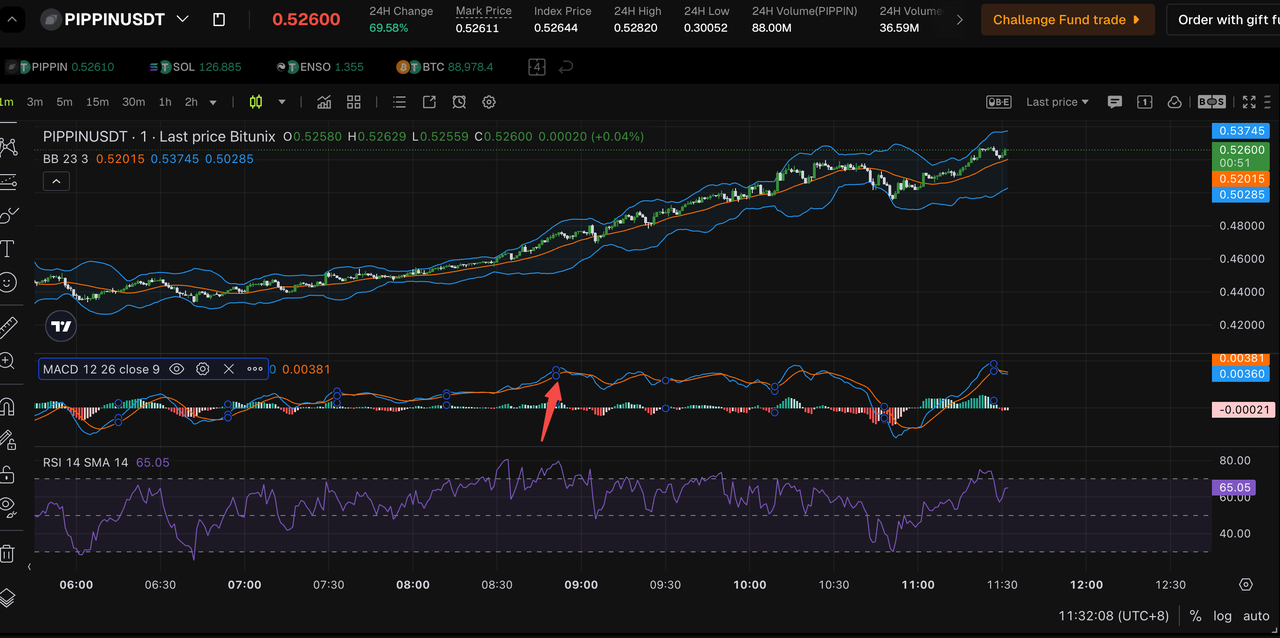
Step 1: Add an indicator
Open the chart, go to Indicators, search MACD, RSI, or Bollinger Bands, then add it to the chart.
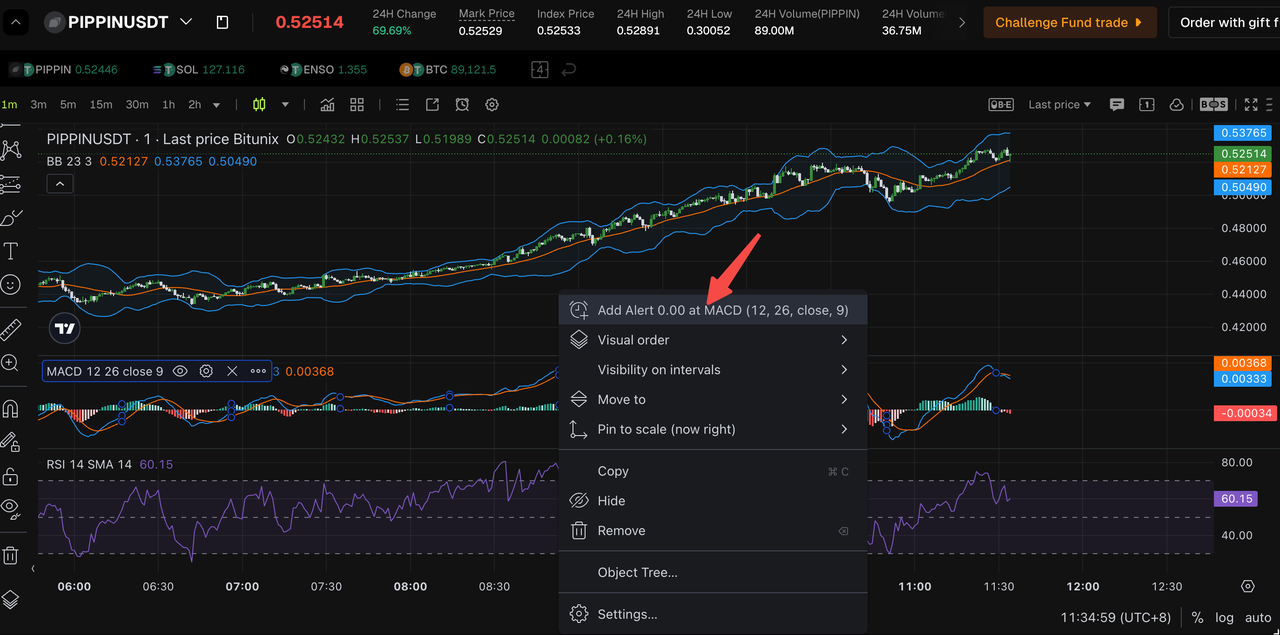
Step 2: Open the alert creation panel
Use a fast entry method from the chart interface, such as:
- Right-click the indicator panel and select Add Alert
- Click the plus icon near the indicator axis label if available
- Open the indicator options menu and select Add Alert
These methods typically prefill the indicator context so you can focus on your trigger settings.
Step 3: Configure the trigger
Select:
- The indicator condition (example: MACD golden cross)
- The monitoring price source if the option is available (open, close, high, low)
- Alert frequency (one-time or repeating)
- Expiration time if you want the alert to stop after a certain period
Step 4: Name it for fast recognition
Use a consistent naming format so alert management stays clean:
Market + Timeframe + Condition
Example: BTCUSDT 15m RSI crosses above 50
How to Create a Drawing Alert
Step 1: Draw your level
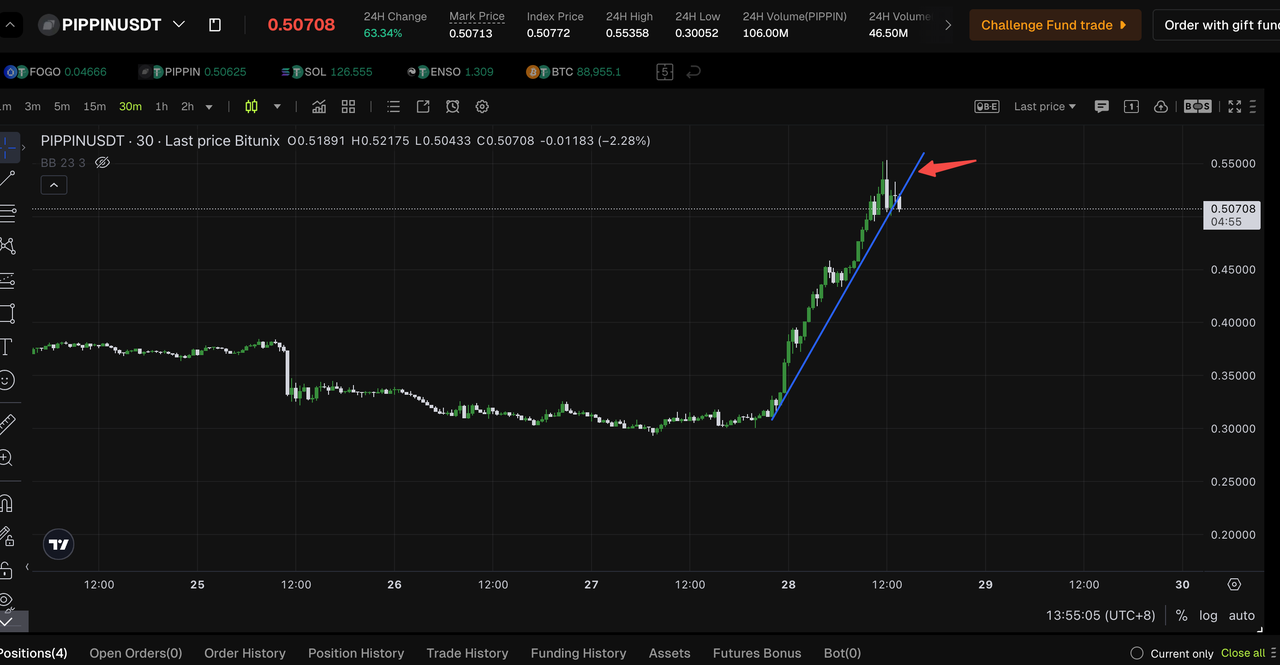
Use a line segment or trendline to mark a key level such as support, resistance, or a trend boundary.
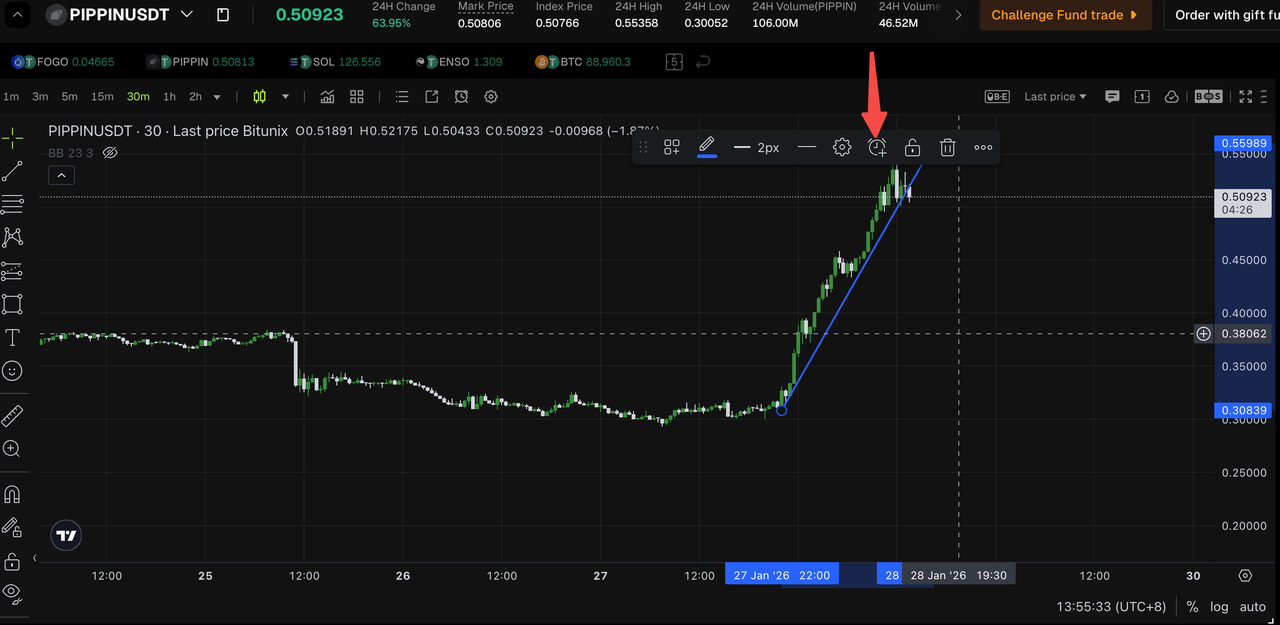
Step 2: Select the drawing and add an alert
Click the drawing to select it, then open the alert option from the drawing edit toolbar.
Step 3: Choose the trigger rule
Common choices include:
- Price touches the line
- Price crosses through the line
- Price breaks above or below the line
Step 4: Set frequency and expiration
For short-term setups, use an expiration time so alerts do not remain active after the setup is no longer relevant.
How to Create a Channel Alert
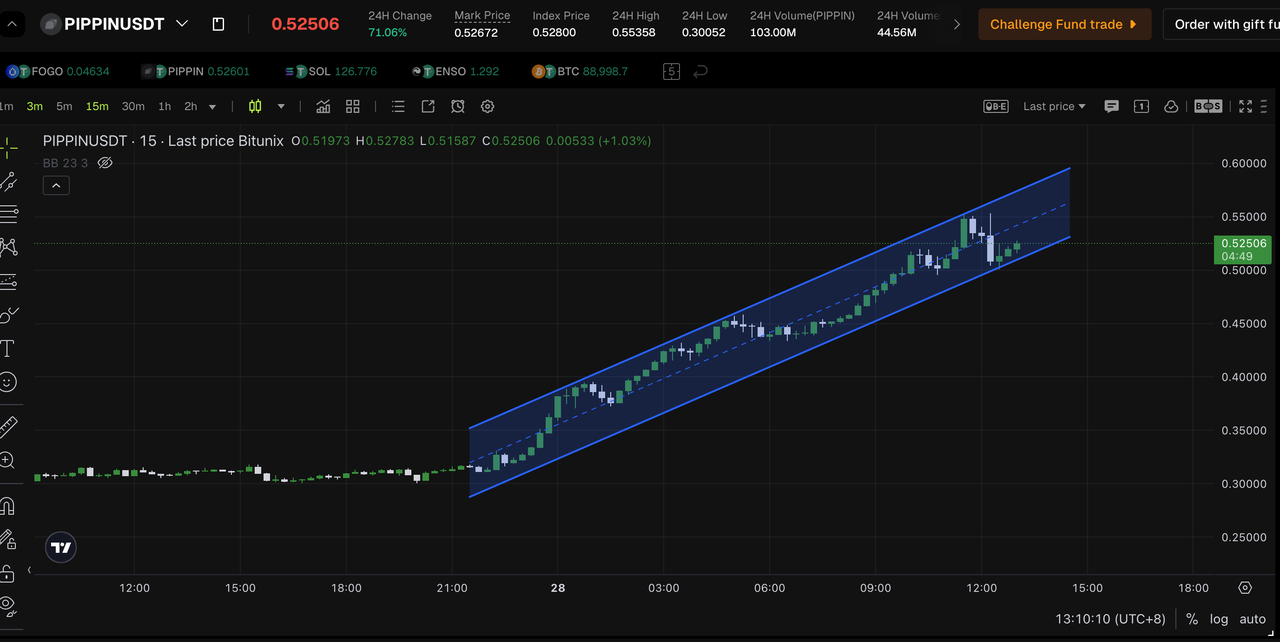
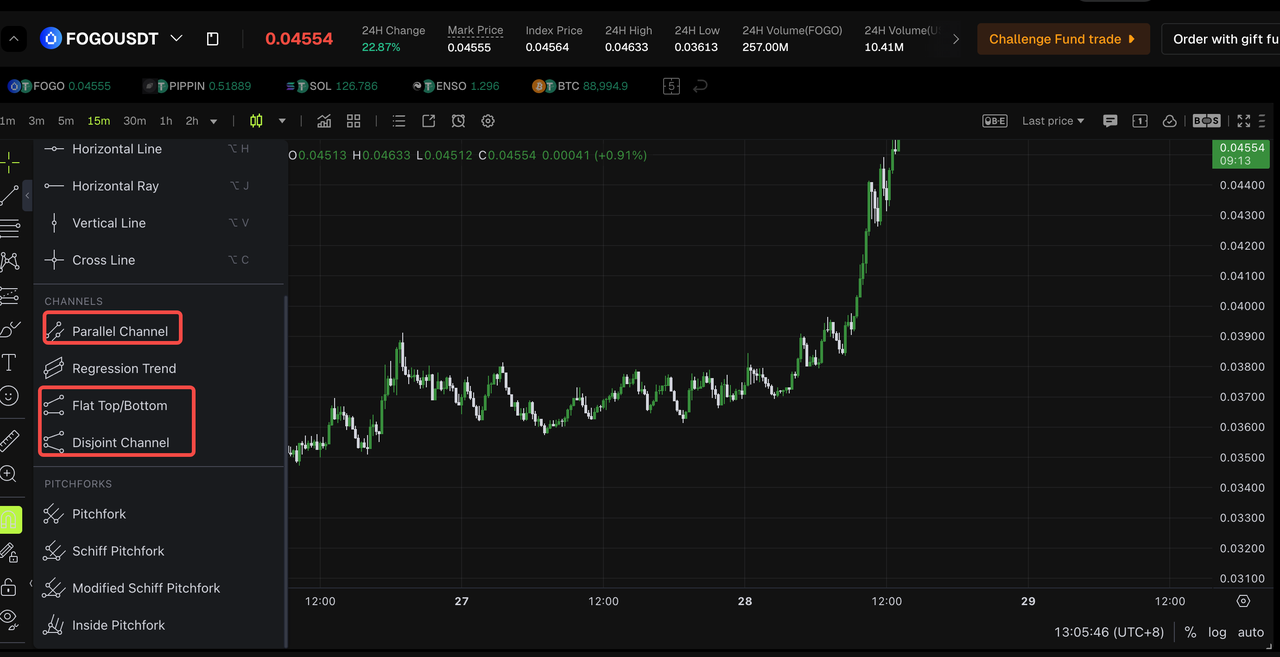
Step 1: Draw the zone
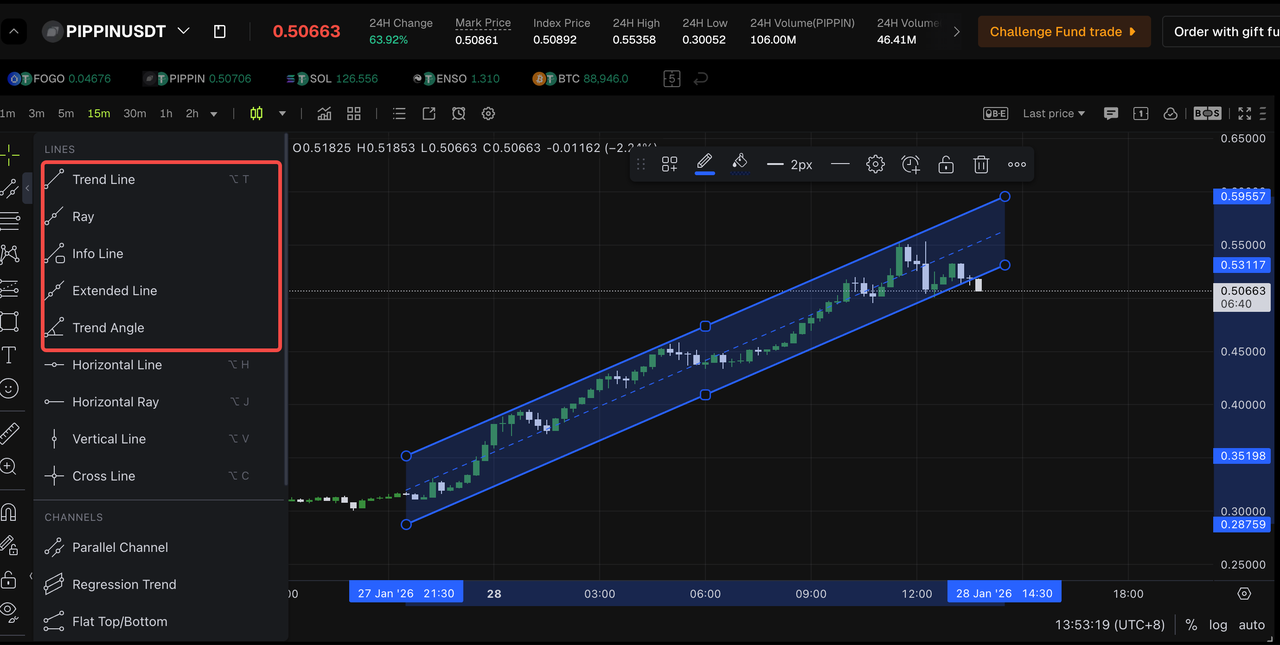
Use a parallel channel to define a trend corridor, or a rectangle to define a range zone.
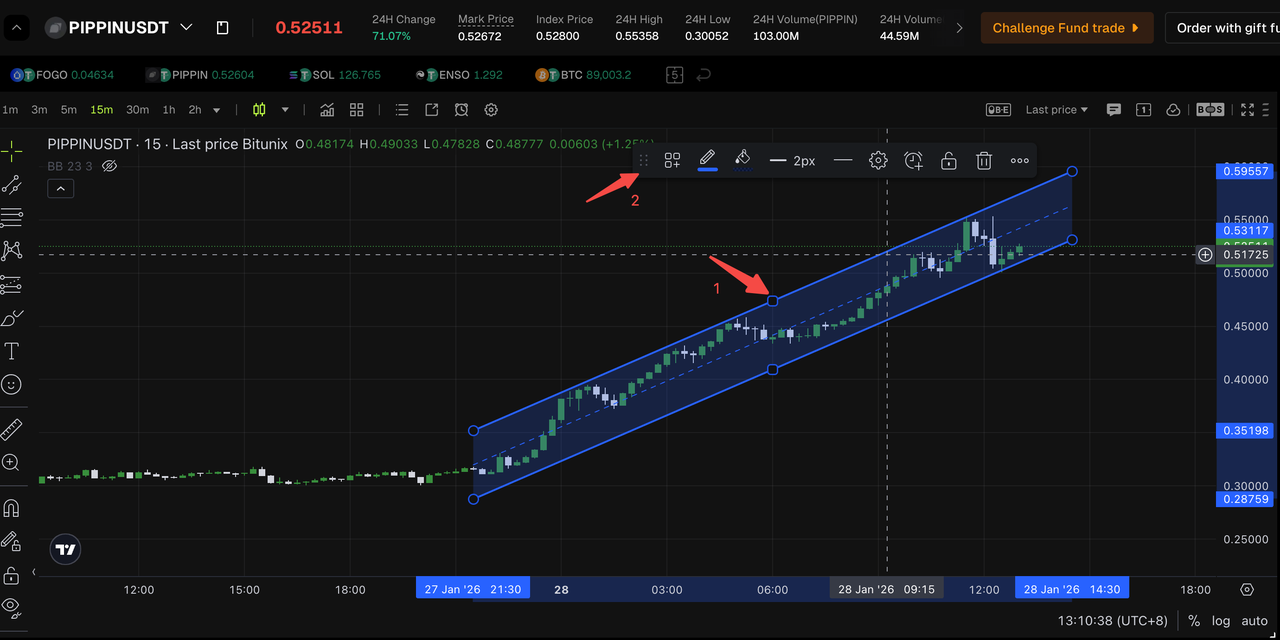
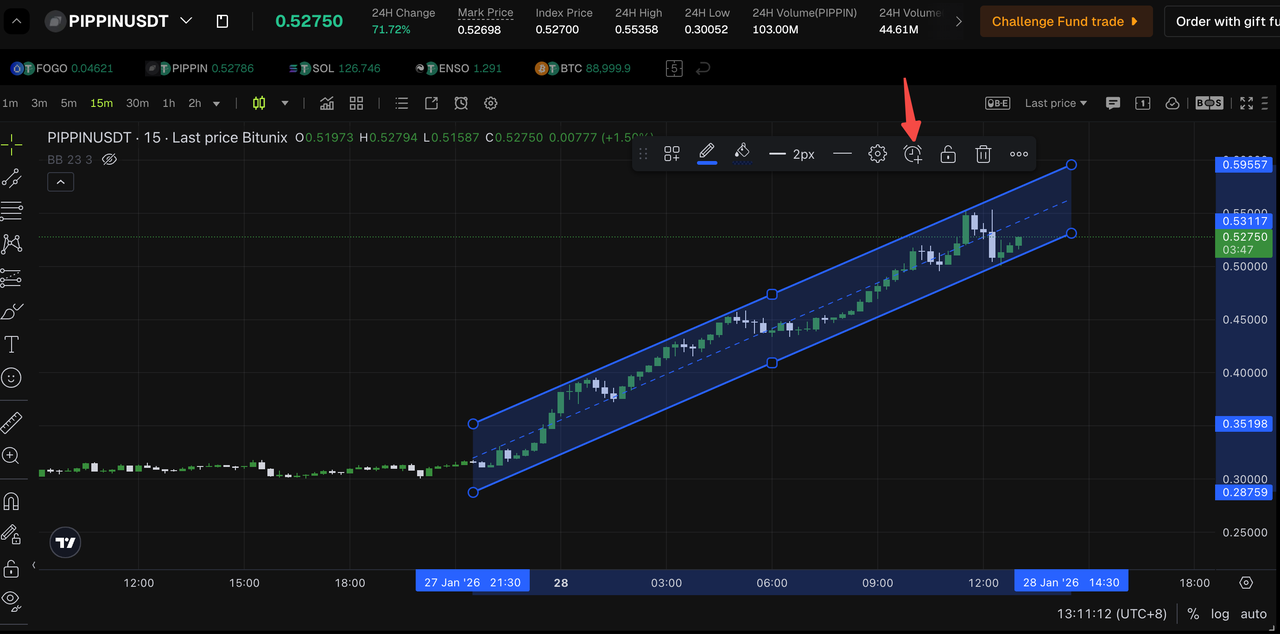
Step 2: Add the alert to the channel
Select the channel or zone, then create an alert from the alert option.
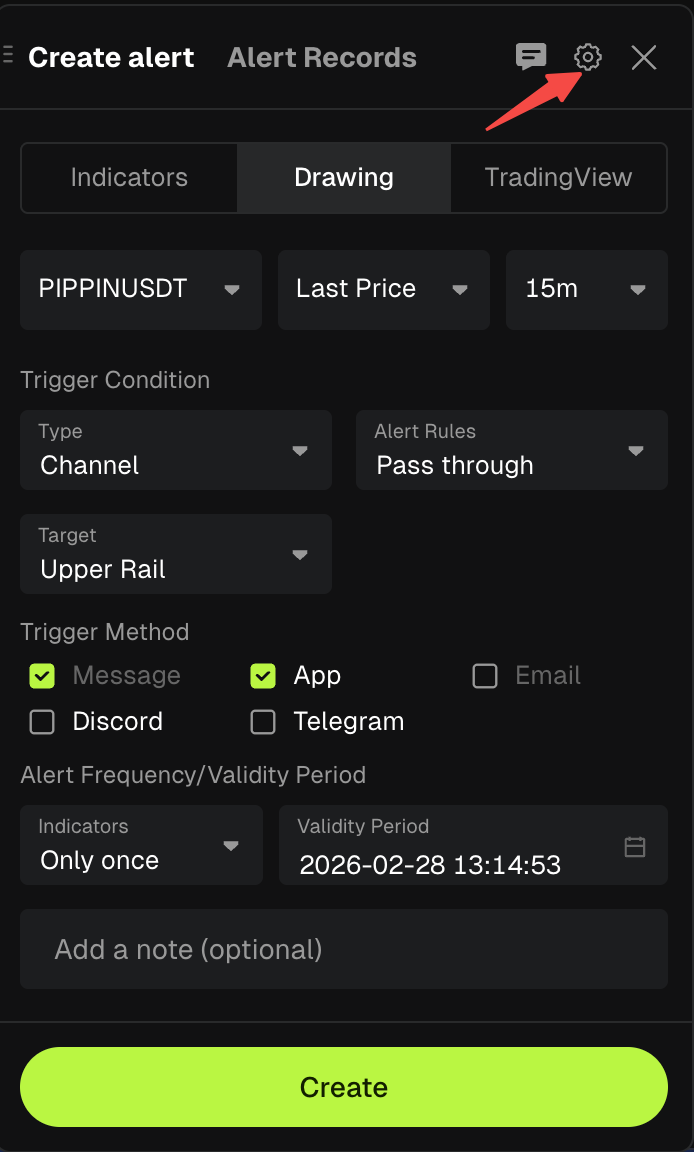
Step 3: Select the target area and behavior
Choose what should trigger the alert, such as:
- Touching or crossing the upper boundary
- Touching or crossing the middle line
- Touching or crossing the lower boundary
- Entering or leaving the channel zone
Alert Personalized Configuration
Personalized Configuration of Alert Sound and Alert Duration
Step 1: Open the Create Alert pop-up window and click the Set button.
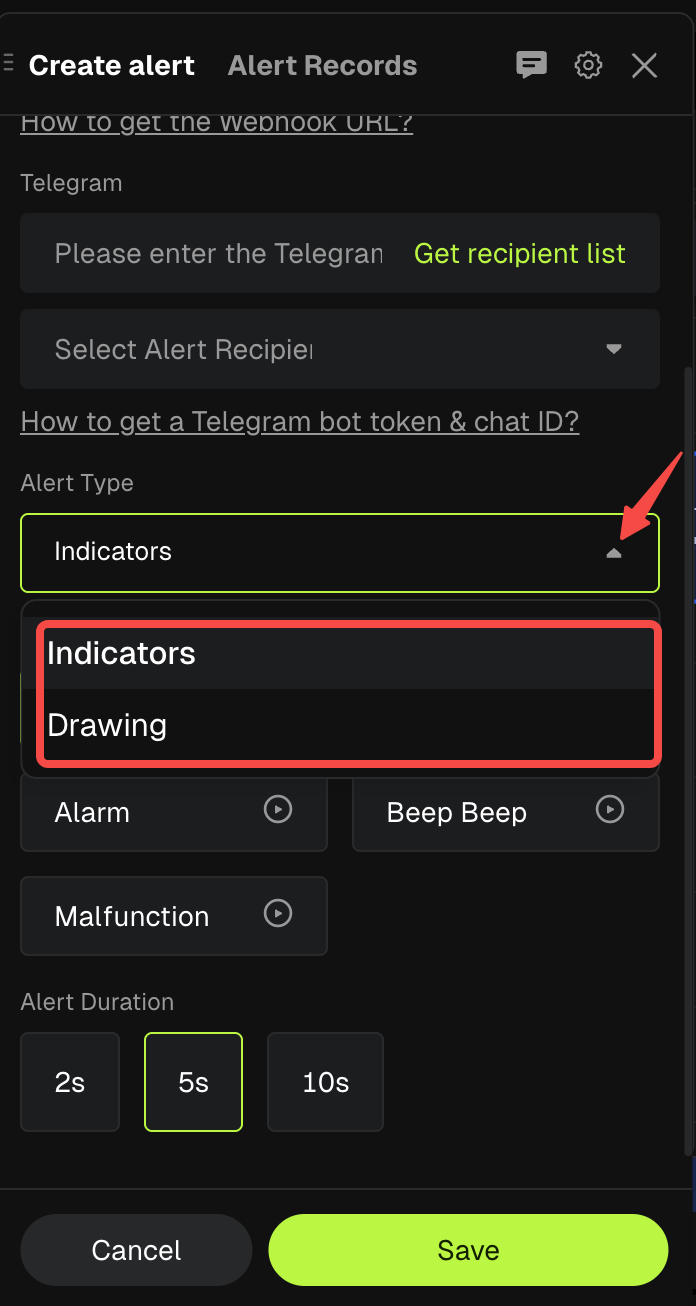
Step 2: Click Select Alert Type and choose the alert type you want to configure:
- Indicator Alert
- Drawing Alert (graph)
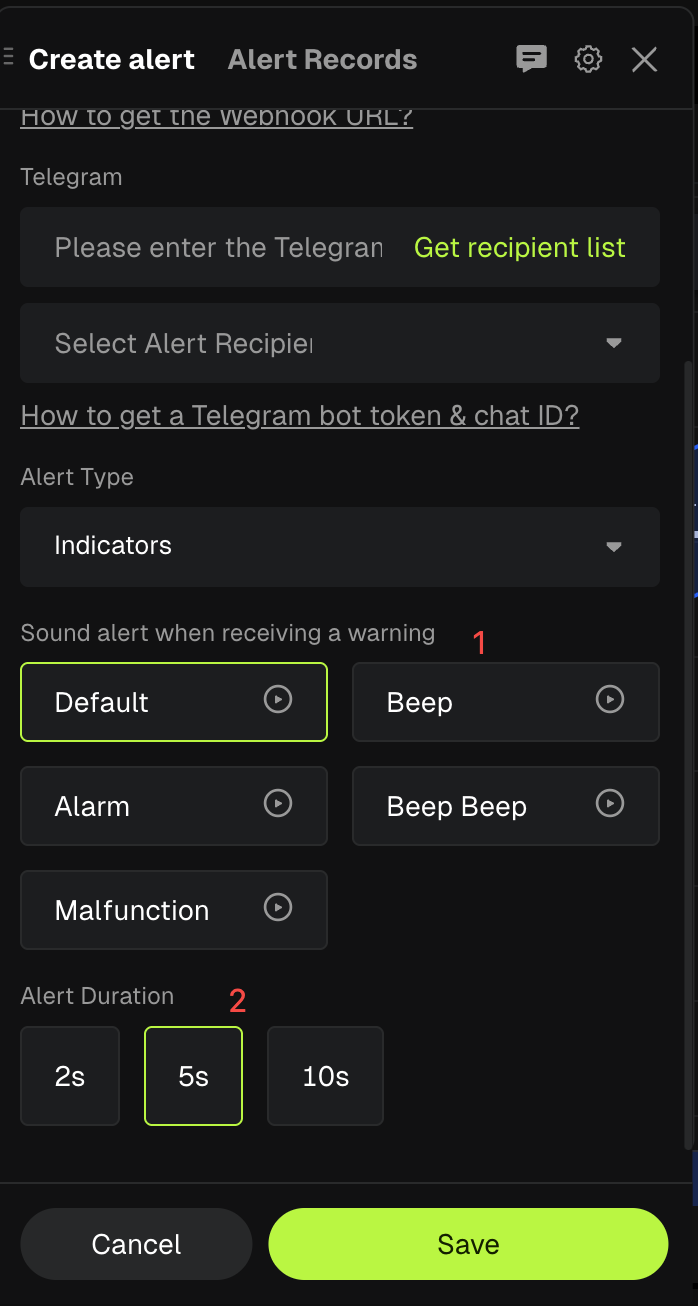
Step 3: Configure Sound and Duration settings.
- Alert Sound: The system includes 5 built-in warning sounds. Click the Play icon to preview each sound, then select the one you prefer.
- Alert Duration: The system supports three duration options: 2 seconds, 5 seconds, and 10 seconds.
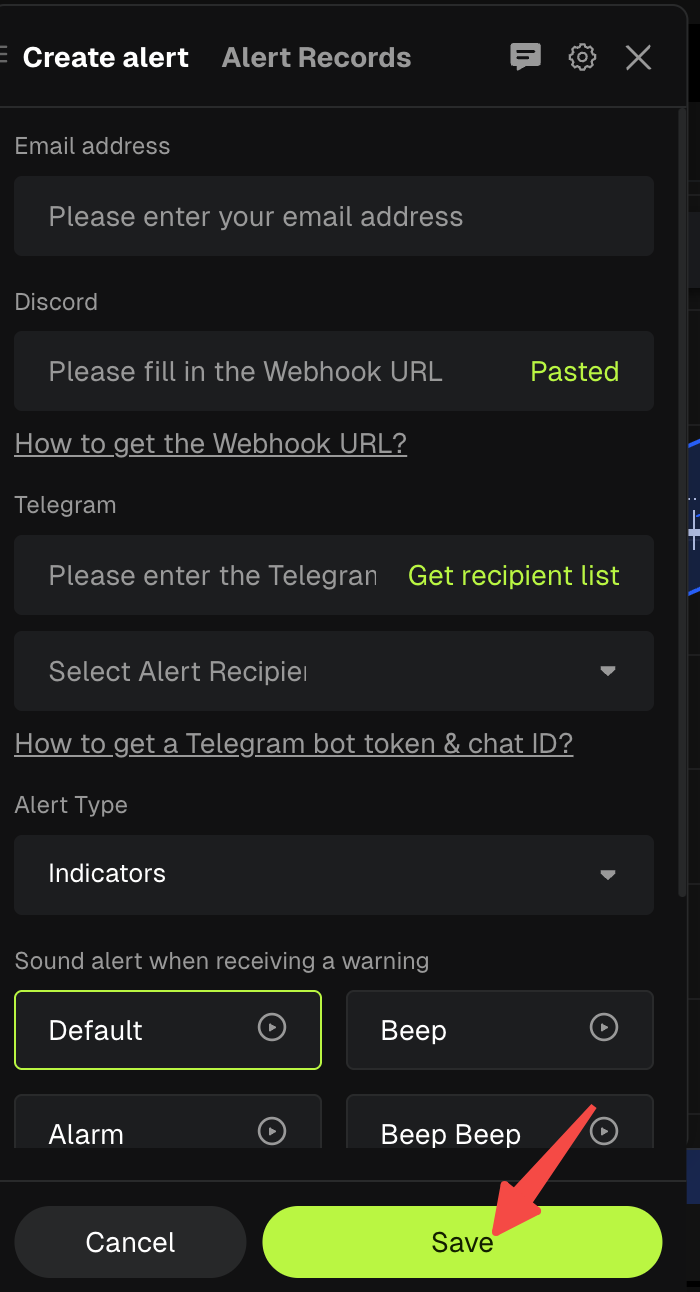
Step 4: After configuration is complete, click Save to apply and keep your current settings.
Best Practices to Catch Anomalies Without Alert Noise
- Use alerts for decision points, not for every minor signal.
- Separate entry alerts from exit alerts.
- Apply expiration times for short-term setups.
- Keep naming consistent so you can review and remove outdated alerts quickly.
- Combine structure and indicator logic for higher-quality triggers, for example a resistance break alert plus an RSI confirmation alert.
Glossary
- Alert Frequency: How often the alert can trigger. Common modes are one-time or repeating.
- Bandwidth (Bollinger Bands): A measure of how wide the bands are. Expansion often signals rising volatility, contraction signals compression.
- Channel: A bounded price corridor used to represent a trend or range zone.
- Condition: The specific rule that triggers an alert, such as a cross, divergence, or threshold comparison.
- DEA: The MACD signal line, often referenced for crosses and zero-line behavior.
- Death Cross (MACD): A bearish crossover where the faster line crosses below the slower line.
- Divergence: A mismatch between price direction and indicator direction that may signal weakening momentum.
- Golden Cross (MACD): A bullish crossover where the faster line crosses above the slower line.
- Monitoring Price Source: The price reference used for evaluation, such as open, close, high, or low.
- Threshold: A fixed level that triggers an alert when crossed, such as RSI above 70 or below 30.
- Validity or Expiration: The time window during which an alert remains active.
FAQ
What indicators are supported in Indicator Warning 1.0?
Indicator Warning 1.0 supports MACD, RSI, and Bollinger Bands.
Can I set alerts on support and resistance lines I draw?
Yes. Drawing Alerts allow you to create alerts tied to chart drawings such as line segments and trendlines.
What is the difference between a Drawing Alert and a Channel Alert?
A Drawing Alert triggers based on a single drawing element like a line or trendline. A Channel Alert triggers based on a zone or corridor such as a parallel channel or rectangle range.
Will an alert trigger only once?
That depends on your alert frequency setting. You can generally set an alert to trigger once or to repeat whenever the condition is met, depending on the available options in the alert panel.
Can I stop alerts automatically after a setup expires?
Yes. Use the expiration setting so alerts stop after a specific time. This is recommended for short-term setups.
Can I receive alerts outside the app?
Depending on your configuration, you may be able to receive alerts through additional channels such as email or messaging integrations. Confirm your delivery settings inside the alert configuration panel.
Does using alerts remove trading risk?
No. Alerts only notify you that a condition occurred. They do not predict outcomes or manage risk for you. Always use your own risk controls and trading plan.
Conclusion
Indicator Warning 1.0 on Bitunix is built for traders who want faster reactions with cleaner workflows. With indicator alerts (MACD, RSI, Bollinger Bands), drawing alerts for key levels, channel alerts for zones, and customizable delivery settings, you can turn your analysis into a structured alert system that helps you spot market anomalies as they happen.
Set fewer, higher-quality alerts, name them clearly, add expiration times, and let the chart notify you when it matters.
About Bitunix
Bitunix is a global cryptocurrency derivatives exchange trusted by over 3 million users across more than 100 countries. The platform is committed to providing a transparent, compliant, and secure trading environment for every user. Bitunix offers a fast registration process and a user-friendly verification system supported by mandatory KYC to ensure safety and compliance. With global standards of protection through Proof of Reserves (POR) and the Bitunix Care Fund, Bitunix prioritizes user trust and fund security. The K-Line Ultra chart system delivers a seamless trading experience for both beginners and advanced traders, while leverage of up to 200x and deep liquidity make Bitunix one of the most dynamic platforms in the market.
Bitunix Global Accounts
X | Telegram Announcements | Telegram Global | CoinMarketCap | Instagram | Facebook | LinkedIn | Reddit | Medium