
How AAPLUSDT Trading Works on Bitunix
Learn how to trade Apple stock on Bitunix with USDT, understand how AAPLUSDT works, and explore volatility, leverage, and risk management for beginners.

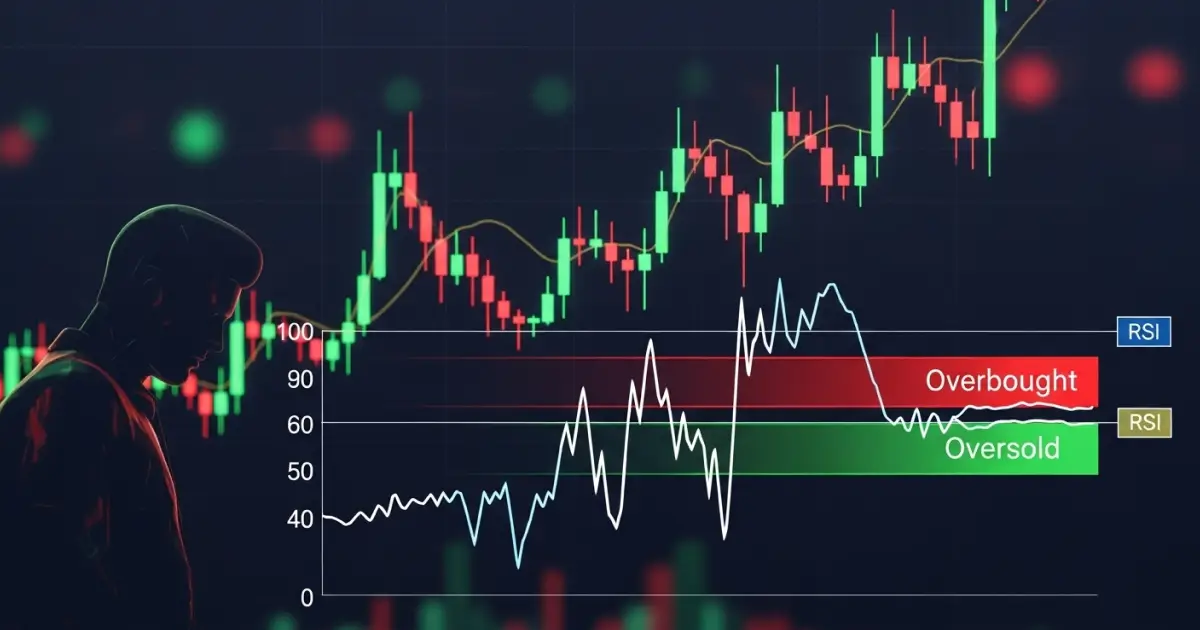
In the world of crypto trading, technical indicators are essential for navigating volatile price movements. Among the many tools available, the Relative Strength Index (RSI) is one of the most popular and widely used. Developed by J. Welles Wilder in 1978, RSI measures price momentum to evaluate whether a cryptocurrency is overbought or oversold.
With digital assets moving faster than traditional markets, RSI provides traders with a simple yet powerful way to time entries and exits. When combined with proper risk management and the right trading platform, RSI can help traders improve accuracy and confidence. This guide explains what RSI is, how to read its signals, and how experienced traders integrate it into successful strategies using Bitunix’s professional-grade tools.
The RSI is a momentum oscillator that fluctuates between 0 and 100. It compares the magnitude of recent price gains to recent losses over a specific period, typically 14 intervals.
Because crypto is more volatile than stocks or commodities, traders often adjust RSI to shorter timeframes like 4-hour or 1-hour charts for quicker signals.
Overbought Conditions When RSI rises above 70, it suggests the asset may be overvalued in the short term. Traders often prepare to secure profits or watch for signs of a pullback.
Oversold Conditions When RSI falls below 30, it suggests heavy selling pressure. Traders may look for entry opportunities before a potential bounce.
Divergences RSI divergences are key signals that experienced traders watch closely:
Midline Crosses The 50 level acts as a neutral zone. An RSI above 50 typically signals bullish momentum, while an RSI below 50 indicates bearish conditions.
Default (14-period RSI): Balanced, widely used in both spot and futures trading.
Shorter settings (7–9 periods): Generate more frequent signals for active traders and scalpers.
Longer settings (21–28 periods): Provide smoother results, preferred for swing and long-term traders.
Traders on Bitunix can adjust RSI settings directly on TradingView-powered charts to tailor signals to their strategy.
Overbought and Oversold Strategy Buy Signal: RSI falls below 30 and begins to rise. Sell Signal: RSI rises above 70 and begins to decline. This strategy is most effective in sideways or ranging markets.
Divergence Strategy When RSI shows divergence with price action, it often signals early market shifts. Spotting divergences can give traders a valuable head start on reversals.
RSI with Support and Resistance RSI signals become more reliable when combined with support and resistance zones. For example, oversold conditions at a strong support level increase the probability of a rebound.
RSI for Trend Confirmation In trending markets, RSI provides confirmation:
This helps traders avoid countertrend mistakes during strong moves.
RSI with Moving Averages Combining RSI with moving averages, such as the 50-day or 200-day average, increases accuracy. For example, RSI oversold signals in an uptrend above the 200-day moving average can provide high-probability entry points.
These examples show that RSI should be used as part of a broader strategy rather than in isolation.
Trading platforms play an important role in turning RSI insights into profitable trades. Bitunix provides features that make RSI strategies more effective:
By combining RSI analysis with Bitunix’s professional-grade trading environment, traders can execute more precise and timely trades.
| Trading Style | RSI Period | Market Type | Use Case |
| Scalping | 7–9 | High volatility | Quick signals |
| Swing Trading | 14 | Sideways/Ranging | Balanced signals |
| Long-Term | 21–28 | Trending markets | Smooth confirmation |
| Indicator | Pairing with RSI | Benefit | Example Use Case |
| MACD | Divergences | Stronger reversal signals | Bullish trend shifts |
| Bollinger Bands | Overbought zones | Volatility confirmation | Range trading |
| Moving Averages | Trend filter | Confirmation of momentum | Swing trades |
The Relative Strength Index remains one of the most effective and accessible tools for crypto traders. By highlighting overbought and oversold conditions, divergences, and momentum shifts, RSI provides valuable insights for both beginners and professionals.
Used on its own, RSI has limitations. However, when combined with trend analysis, support and resistance, and strong risk management, RSI can significantly improve trading outcomes.
On the Bitunix platform, traders gain access to advanced RSI charting, fast order execution, alerts, copy trading, and futures markets. These tools make it easier to apply RSI strategies with confidence in volatile crypto markets.
Disclaimer: Trading digital assets involves risk and may result in the loss of capital. Always do your own research. Terms, conditions, and regional restrictions may apply.
The default 14-period setting is the most widely used. Active traders may shorten to 7–9 for quicker signals.
Yes. RSI is effective in both spot and futures trading. Futures traders often prefer shorter settings for faster entries.
It can be, but it should be confirmed with volume, trendlines, or support and resistance to reduce false signals.
Combine RSI with moving averages, MACD, or Bollinger Bands for confirmation.
Yes. RSI is beginner-friendly and one of the simplest indicators to start with.
Bitunix is one of the world’s fastest growing professional derivatives exchanges, trusted by over 3 million users across more than one hundred countries. Ranked among the top exchanges on major data aggregators, Bitunix processes billions in daily volume and offers a comprehensive suite of products including perpetual futures with high leverage, spot markets, and copy trading. Users can trade bitcoin and other major cryptocurrencies on the platform, taking advantage of advanced trading features. Known for its Ultra K line trading experience and responsive support, Bitunix provides a secure, transparent, and rewarding environment for both professional and everyday traders. Bitunix Academy adds structured lessons so you can build skills while you trade.
Bitunix Global Accounts
X | Telegram Announcements | Telegram Global | CoinMarketCap | Instagram | Facebook | LinkedIn | Reddit | Medium
Disclaimer: Trading digital assets involves risk and may result in the loss of capital. Always do your own research. Terms, conditions, and regional restrictions may apply.


