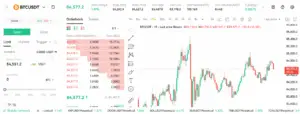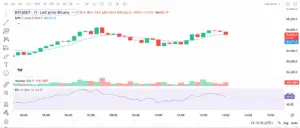
What Are Crypto Charts?
Key Components of a Chart
- X-Axis: Time (e.g., 1-minute, 1-hour, 1-day candles)
- Y-Axis: Price of the asset
- Chart Type: Line, bar, or candlestick
- Indicators: Overlays and technical tools for analysis
Real-Time Application
- Trends
- Reversals
- Breakouts
- Entry/exit opportunities

How to Read Crypto Charts
Candlestick Charts
- Open price (when the time interval began)
- Close price (when it ended)
- High and Low prices
Trends: Uptrend, Downtrend, Sideways
- Uptrend: Higher highs + higher lows
- Downtrend: Lower highs + lower lows
- Sideways: Consolidation or range-bound market
Support and Resistance
- Support: A price level where buying interest tends to appear
- Resistance: A level where selling pressure halts further gains
Volume

How to Read Crypto Charts for Day Trading
Choose the Right Timeframe
- 1-min and 5-min: High-speed scalping
- 15-min to 1-hour: Short-term intraday moves
- 4-hour & daily: Trend confirmation
Combine Indicators
- EMA (9, 20, 50): Trend tracking and crossovers
- RSI: Measures overbought/oversold zones
- MACD: Signals bullish or bearish momentum shifts
Use Chart Patterns
- Bullish Flags: Quick rest before continuation up
- Head & Shoulders: Reversal pattern
- Double Bottom: Bullish reversal signal
Important Note:
How Do Crypto Charts Work
Behind the Scenes
- Every buy/sell order gets recorded on the exchange.
- Price candles are formed based on these executed trades.
- Volume bars count how many trades happened at each price/time point.
Chart Types (Quick Recap)
- Line Chart: Simple price trend
- Bar Chart (OHLC): Includes open, high, low, close
- Candlestick: Visual + detailed (industry standard)
Reading Crypto Charts (Patterns + Indicators)
Candlestick Patterns
- Doji: Market indecision
- Hammer: Bullish reversal
- Shooting Star: Bearish reversal
- Engulfing: Strong reversal when a full candle swallows the previous one
Chart Patterns
- Ascending Triangle: Bullish
- Descending Triangle: Bearish
- Wedge Patterns: Reversal or breakout
- Cup and Handle: Long-term bullish setup
Indicators to Master
- MACD Crossover = potential shift in momentum
- RSI Divergence = early reversal warning
- Bollinger Bands = volatility range (squeeze = breakout risk)
How to Analyze Crypto Charts (Strategy Application)
Multiple Timeframe Analysis
Entry Strategy Example
- Check 4H chart → higher highs, MACD positive
- Zoom into 15m → RSI breaks out from oversold, price above 20 EMA
- Volume surges → Entry
Exit and Stop Loss
- Place stop-loss below recent swing low
- Set take-profit at next resistance level or using Fib extensions
Common Mistakes to Avoid When Reading Charts
- Overtrading: Don’t chase every candle
- Ignoring volume: Confirmation matters
- Too many indicators: Keep it clean — 2–3 max
- No stop-loss: Always define your risk
Conclusion
- Real-time interactive charts
- Advanced technical indicators
- Fast execution engine
- User-friendly mobile app for charting on the go
Ready to level up your trading?
FAQs
What’s the best chart type for beginners?
How do I know if a trend is reversing?
Are technical indicators reliable?
How many indicators should I use on a chart?
Can I trade just using patterns?
About Bitunix
Bitunix is one of the world’s fastest growing professional derivatives exchanges, trusted by over 3 million users across more than one hundred countries. Ranked among the top exchanges on major data aggregators, Bitunix processes billions in daily volume and offers a comprehensive suite of products including perpetual futures with high leverage, spot markets, and copy trading. Users can trade bitcoin and other major cryptocurrencies on the platform, taking advantage of advanced trading features. Known for its Ultra K line trading experience and responsive support, Bitunix provides a secure, transparent, and rewarding environment for both professional and everyday traders. Bitunix Academy adds structured lessons so you can build skills while you trade.
Bitunix Global Accounts
X | Telegram Announcements | Telegram Global | CoinMarketCap | Instagram | Facebook | LinkedIn | Reddit | Medium
Disclaimer: Trading digital assets involves risk and may result in the loss of capital. Always do your own research. Terms, conditions, and regional restrictions may apply.


One reply on “Crypto Charts – How to Read Cryptocurrency Charts”
I have been surfing online more than 4 hours
today, yet I never found any interesting article like yours.
It is pretty worth enough for me. In my view, if
all website owners and bloggers made good content as you did, the web will be a lot
more useful than ever before.